Tag Archives: Technical Analysis

11/19/19 S&P reverses, barely.

2-month (approx.) focus chart.

Current Market Prediction (slow model):

$SPX (S&P 500), Bull-trend signal (10/18/19) with TTP= 3006.72.

Current price for CTM research (signals), $15,000 per quarter for the S&P 500 “fast” nonlinear model. The faster model is more optimized for options trading.

Model notes: Todays S&P 500 small-scale reversal (less than 2 points) may be more sympathetic to the DJIA losing ground on the back of Home Depot losses (-5% plus). The model seems to still be in-sync with the current t uptrend. We are just a couple points off the 2-month closing high.  Chaotic trend / nonlinear trend analysis is giving us the glimpse at the future ahead.

What is the S&P 500 signaling about current events? We have discussed this about a week now and the major index continues to drift upwards. Today’s action continues to show the market is not really concerned. The side topic of an escalated “trade war” with China

Note: The following comments are based on using technical analysis to ‘flesh out’ our nonlinear trading signals. TTP (Theoretical Transaction Day) is defined as the closing price on the day following the signal day.

Nonlinear Trading Themes:

  • S&P 500 forecast (SPX): The S&P basically drifted higher over the last couple of days.  Today’s 2 pt downside reversal is pretty tame considering action of the last 2 months.  We keep saying (in various ways) that the bears just don’t seem to be able to pull a meaningful raid off. The impeachment proceedings are not producing enough angst among market participants to be a bearish factor (lack-luster testimony and Republican control of the Senate are contributing to the peace). Technical trend is still up. Nonlinear / Chaotic indicators are still bullish. We are keeping a lookout in case darker clouds arise.

GH Garrett – Chief Market Analyst for ConquertheMummy.com  © 2015-2019, “Nonlinear trading signals that matter in stock index and S&P 500 trading. Determine the direction of the S&P and trading becomes much less complex.”

Master Sergeant Bilko (the movie version) said, “I like a sporting event in which I know the outcome beforehand, it’s more organized.”
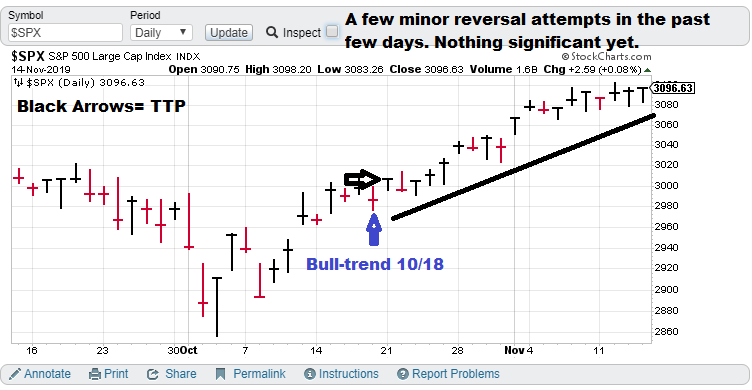
11/14/19 Several minor reversal attempt recently, nothing significant yet.

2-month (approx) focus chart.

Current Market Prediction (slow model):

$SPX (S&P 500), Bull-trend signal (10/18/19) with TTP= 3006.72.

Current price for CTM research (signals), $15,000 per quarter for the S&P 500 “fast” nonlinear model. The faster model is more optimized for options trading.

Model notes: Todays S&P 500 close is the highest of the week so far.  So far, we have kept with the trend while avoiding being tripped out by false signals that trick bulls out of a bullish trend. Model still in-sync. Chaotic trend / nonlinear trend analysis is giving us the glimpse at the future trend.

What? Well, the impeachment is on. With a Republican controlled senate, it seems like a waste of time. I would like to share how I look at this. The Democratic Party is fractured into 2 halves: liberals (Biden) and progressives (Jr. Communist, Bernie Sanders). Progressives consider Warren a liberal, trying to pass herself off as a progressive. The liberals have received some analysis advising them they will lose 2020 no matter who runs from their current 3+1 (Buttigieg) team. For them the impeachment is a disparate “hail Mary” pass, trying to snatch victory from defeat. The progressives are actually trying to take over the Democratic Party. To them this is an attempt to remove Joe Biden through displaying Hunter Biden’s corruption (also a jab at Trump is okay for them). The market is taking a longer-term view of this and is ignoring the hearings largely.

Note: The following comments are based on using technical analysis to ‘flesh out’ our nonlinear trading signals. TTP (Theoretical Transaction Day) is defined as the closing price on the day following the signal day.

Nonlinear Trading Themes:

  • S&P 500 forecast (SPX): S&P closed at the high of the week, despite limited selling over the past several trading days, since Nov 7th.  The bears don’t seem to have the firepower to drive the market down yet. The clumsy political machinations by the Democratic Party has not provided enough angst (against the backdrop of a Republican-controlled Senate) to bring in sellers. Technical trend is still up. Nonlinear / Chaotic indicators are still bullish. We are watching.

GH Garrett – Chief Market Analyst for ConquertheMummy.com  © 2015-2019, “Nonlinear trading signals that matter in stock index and S&P 500 trading.”

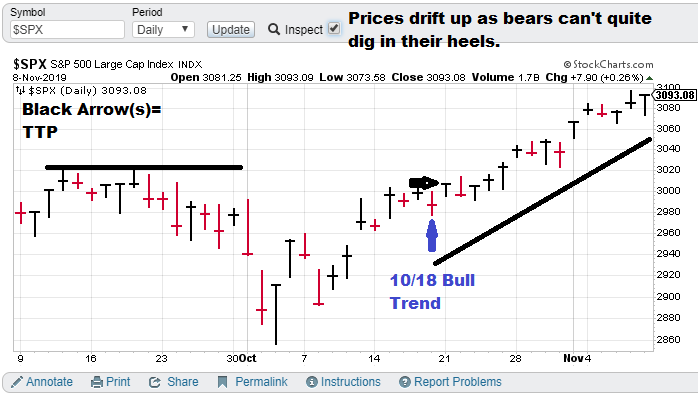
11/8/19 S&P 500 drifts up, bears can’t dig in their heels yet.

2-month (approx) focus chart.

Current Market Forecast (slow model):

$SPX (S&P 500), Bull-trend signal (10/18/19) with TTP= 3006.72.

Current price for CTM research (signals), $15,000 per quarter for the S&P 500 “fast” nonlinear model. The faster model is more optimized for options trading.

Model notes: S&P 500 closes at the high of the week, sellers attempt a couple reversal attempts but couldn’t get it going. Model still in-sync. Chaotic trend / nonlinear trend analysis is giving us the glimpse at the future trend.

What? Have a great Veterans Day!

Note: The following comments are based on using technical analysis to ‘flesh out’ our nonlinear trading signals. TTP (Theoretical Transaction Day) is defined as the closing price on the day following the signal day.

Nonlinear Trading Themes:

  • S&P 500 forecast (SPX): Stocks have broken through mid-October highs and we don’t see a serious technical reversal yet. Technical trend is still up. Nonlinear / Chaotic indicators are still bullish.

GH Garrett – Chief Market Analyst for ConquertheMummy.com  © 2015-2019, “Nonlinear trading signals that matter in stock index and S&P 500 trading.”

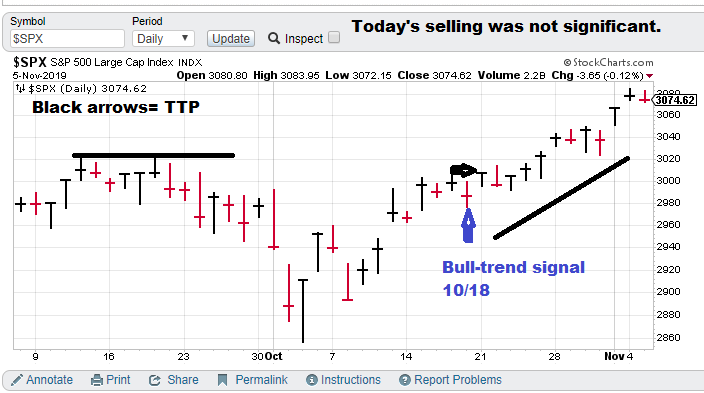
11/5/19 S&P 500 posts gains with a nonlinear nod!

11/5/19 S&P 500 posts gains with a nonlinear nod!

2-month (approx.) focus chart.

Current Market Predictions:

$SPX (S&P 500), Bull-trend signal (10/18/19) with TTP= 3006.72.

Current price for CTM research (signals), $15,000 per quarter for the S&P 500 “fast” nonlinear model. The faster model is more optimized for options trading.

Model notes: The model is in-synch with the market. Price action for the bull-trend is still upward with the most current close above the TTP. Chaotic trend / nonlinear trend analysis is giving us the edge in time-series prediction.

What? The Democratic party continues to struggle with selecting a presidential candidate. 3 top tier contenders and dark horse Pete Buttigieg (he is advancing from the lower tier).

Note: The following comments are based on using technical analysis to ‘flesh out’ our nonlinear trading signals. TTP (Theoretical Transaction Day) is defined as the closing price on the day following the signal day.

Nonlinear Trading Themes:

  • S&P 500 forecast (SPX): The bullish trend signal took some minor selling today, but the bears lacked conviction. Technical trend is still up. Nonlinear indicators are still bullish.

GH Garrett – Chief Market Analyst for ConquertheMummy.com  © 2015-2019, “Nonlinear trading signals that matter in stock index and S&P 500 trading.”

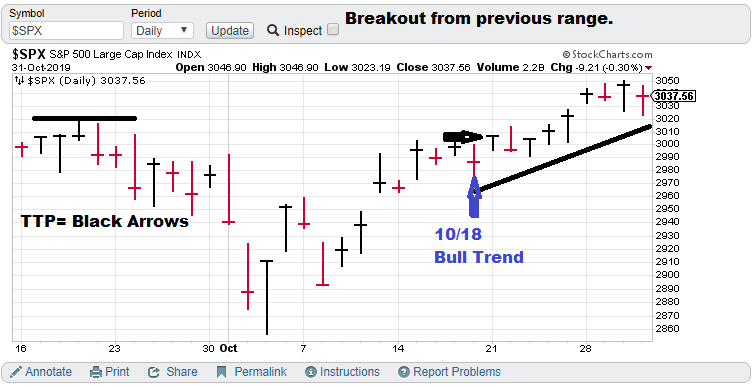
10/31/19 S&P 500 breaks out of the recent trading range!

2-month (approx.) focus chart.

Current Market Predictions:

$SPX (S&P 500), non-linear model indicates that the trading trend is now up for this index. Today (10/18/19) is the signal day. The closing price on Monday (10/21).  TTP (Theoretical Transaction Day) = 3006.72.

Current price for CTM research (signals), $15,000 per quarter for the S&P 500 “fast” nonlinear model. The faster model is more optimized for options trading.

Model notes: The model is in-synch with the market. The most recent close is higher than the close on the recent signal date and the TTP.  Chaotic trend / nonlinear trend analysis is giving us the edge in time-series prediction.

What? The death of the ISIS bigwig (Ibrahim Awad Ibrahim al-Badri) was a positive for stock trading. ISIS strength is hardly a positive for prosperity in the US.

Note: The following comments are based on using technical analysis to ‘flesh out’ our nonlinear trading signals. TTP (Theoretical Transaction Day) is defined as the closing price on the day following the signal day.

Nonlinear Trading Themes:

  • S&P 500 forecast (SPX): The trading trend made significant technical progress this week with Friday’s breakout close. Nonlinear indicators are still bullish.

GH Garrett – Chief Market Analyst for ConquertheMummy.com  © 2015-2019, “Nonlinear trading signals that matter in stock index and S&P 500 trading.”

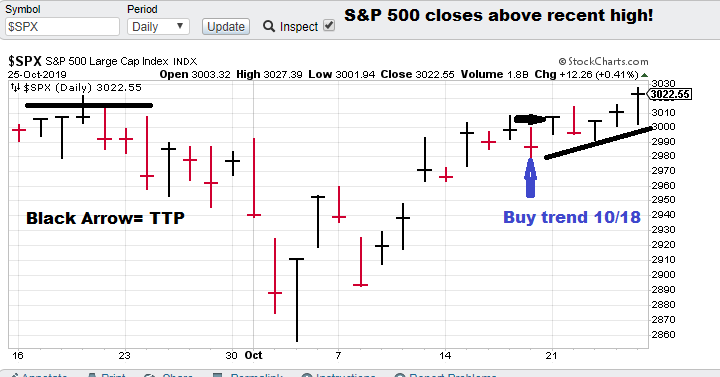
10/25/19 S&P 500 closes above recent high close!

2-month (approx.) focus chart.

Current market Predictions:

$SPX (S&P 500), non-linear model indicates that the trading trend is now up for this index. Today (10/18/19) is the signal day. The closing price on Monday (10/21).  TTP (Theoretical Transaction Day) = 3006.72.

Current price for CTM research (signals), $15,000 per quarter for the S&P 500 “fast” nonlinear model. The faster model is more optimized for options trading.

Model notes: The model is looking good. Price closed at a new recent high 5 trading days after signal date. Chaotic trend analysis is giving us the edge in time-series prediction.

What? The impeachment effort is starting to look more like the Crazy Train.  So far, it’s not holding the market back.

Note: The following comments are based on using technical analysis to ‘flesh out’ our nonlinear trading signals. TTP (Theoretical Transaction Day) is defined as the closing price on the day following the signal day.

Nonlinear Trading Themes:

  • S&P 500 Index forecast (SPX): The trading trend made significant technical progress this week with Friday’s breakout close. Nonlinear indicators are still bullish.

GH Garrett – Chief Market Analyst for ConquertheMummy.com  © 2015-2019, “Nonlinear trading signals that matter in stock index and S&P 500 index trading.”

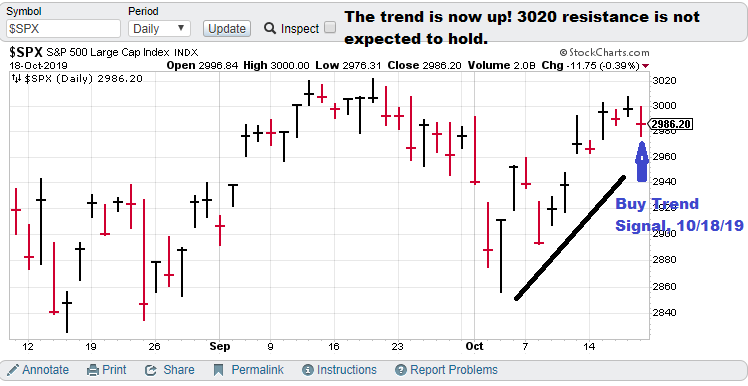
10/18/19 Changing our direction. S&P 500 is our new target! A bullish start!

2-month (approx.) focus chart.

Current market Predictions:

$SPX (S&P 500), non-linear model indicates that the trading trend is now up for this index. Today (10/18/19) is the signal day. The closing price on Monday is the TTP (Theoretical Transaction Day).

Current price for CTM research (signals), $15,000 per quarter for the S&P 500 “quick march” nonlinear model. It is a faster model more optimized for options trading.

Model notes: My data provider seemed to go AWOL on my bitcoin data for almost a week. I am taking this opportunity to optimize the nonlinear models on the far more popular S&P 500 index. The model signals are from our basic model.

What? On my last post I indicated that Ukraine impeachment initiative is a progressive plot to weaken Biden’s presidential bid, which it has done in terms of reducing fund raising and voter poll results. Warren seems to be benefitting, moving to front runner status.  However, she has another issue. Electability.

Note: The following comments are based on using technical analysis to ‘flesh out’ our nonlinear trading signals. TTP (Theoretical Transaction Day) is defined as the closing price on the day following the signal day.

Nonlinear Trading Themes:

  • S&P 500 Index forecast ($SPX): The trading trend is pointed skyward. Nonlinear indicators expect the index to break through the 3020 level.

GH Garrett – Chief Market Analyst for ConquertheMummy.com  © 2015-2019, “Nonlinear trading signals that matter in stock index and S&P 500 index trading.”

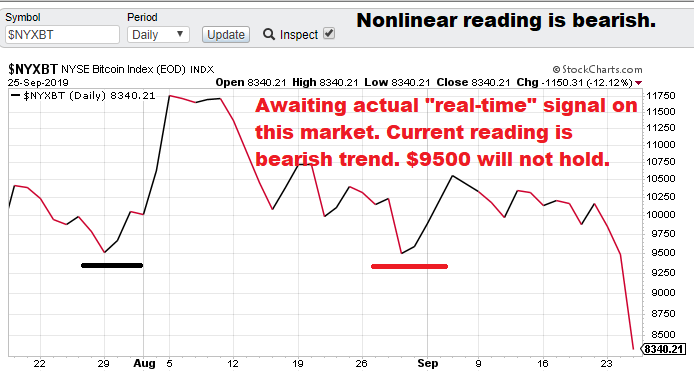
09/25/19 Status: $9500.xx support level failing

2-month (approx.) focus chart.

Current market Predictions:

  • $NYXBT (Bitcoin), bearish since model (V6.0) went online, awaiting “real-time” signal with a current TSP. I don’t post hypothetical model trades.

Current price for CTM research, $15,000.xx per quarter for two symbols.

Model notes: This is basically the debut of the 6.0 version. This approach is more mathematically elegant and should help CTM research models to stay in-synch with the underlying markets that are being modelled. This is a big deal in non-linear modelling.   I am going to shoot more to post once a week instead of just trend changes.

What? The Pelosi impeachment investigation is billed as a “get Trump” political action. Lack of evidence to such a high crime is not present. This is more likely a “backdoor” Democratic Part infighting move to take Joe Biden out of the presidential hopeful list, possibly to create room for a more progressive candidate to get traction. I don’t see this as a particularly well thought out move (Dems are synonymous with the unpopular ailment known as “Impeachment fatigue”). Still as a short-term move to rearrange the Democratic hopeful list, sometimes the gunfight goes simply to the quick.

Note: The following comments are based on using technical analysis to ‘flesh out’ our nonlinear trading signals. TSP is defined as the closing price on the day following the signal day.

Nonlinear Trading Themes:Bitcoin forecast ($NYXBT): Now we are looking for the cryptocurrency to move lower. Near-term support at $9500 has been pierced.

GH Garrett – Chief Market Analyst for ConquertheMummy.com  © 2015-2019, “Nonlinear trading signals that matter in bitcoin trading.”

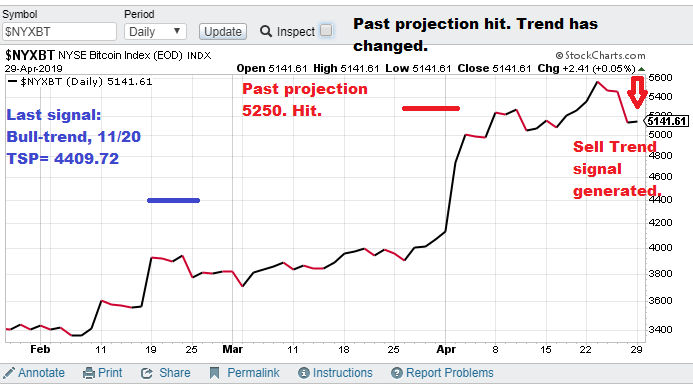
04/29/19 Status: Sell trend signal. Projection hit.

3-month focus chart.

Current market Predictions:

  • $NYXBT (Bitcoin), 4/29/18, bear trend signal. TSP (4/30) = waiting.  Downside 3-month bitcoin price forecast = Calculating.
  • $VIX signal, waiting. This is a new signal current trend is down. We are waiting for the first signal to start posting a chart.

Current price for a 4 symbol package = $7,500 quarterly.

Model notes: Bitcoin trend change signal comes after hitting our upside projection. The sell TSP should be higher than the entry (assuming tomorrows close is near today’s). So the model is still in synch with the market. The downside projection will be posted later. We plan to add a Vix signal as well. Volatility is another strange non-traditional market that should be benefitted by looking through the lens nonlinear analysis.

Note: The following comments are based on using technical analysis to ‘flesh out’ our nonlinear trading signals. TSP is defined as the closing price on the day following the signal day.

Nonlinear Trading Themes:

  • Bitcoin forecast ($NYXBT): Now we are looking for the cryptocurrency to move lower. The market has hit the upside projection and nonlinear analysis forecasts more weakness ahead.
  • $VIX forecast: Awaiting a fresh signal (this is a new venture). The market has been beaten down in the wake of S&P 500 strength. Currently the index habitats in the 12-13 range.

GH Garrett – Chief Market Analyst for ConquertheMummy.com  © 2015-2019, “Nonlinear trading signals that matter in bitcoin trading.”

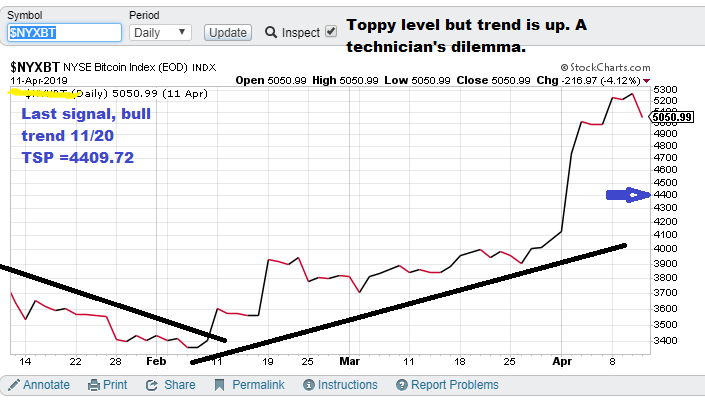
04/12/19 Status: The Rocket kicked off (finally) in our direction!

3-month focus chart.

Current Cryptocurrency Prediction:

  • $NYXBT (Bitcoin), 11/20/18, bull trend signal. TSP (11/21) = 4409.72. Upside 3-month bitcoin price forecast is 5250.

Current price for a 4 symbol package = $7,500 quarterly.

Model notes: This post was made Friday (April 12) midday, looking back at the chart updated through April 11. The great news is that the chaos nonlinear forces have finally kicked in and Bitcoin moved decisively higher. The “catch the falling knife” bull trend signal (11/20) is now “in the money.” We briefly kissed our nonlinear forecast projection (5250). Basically I am waiting for the projection to ratchet up of have a reversal signal. The model is still in-synch with the trading.

Signs and Times: Since the Mueller investigation concluded, I think the Clintons have disappeared. I don’t see them in the media. It is as if a UFO came and collected them late one night. Or they could be hunkered down in a bunker surrounded by lawyers, carefully listening across the waters for Trump to yell “Starboard side, prepare to fire!”

Note: The following comments are based on using technical analysis to ‘flesh out’ our nonlinear trading signals. TSP is defined as the closing price on the day following the signal day.

Nonlinear Trading Themes:

  • Bitcoin forecast ($NYXBT): Wow! Bitcoin rocketed up 25% in a month. We are now at our projection area warning this could be a toppy market. On the other hand, the trend is still pointed upward. So, I am waiting for either a trend signal change or an upward market projection to higher levels. The classic technician’s dilemma. For now the nonlinear process is still up.

GH Garrett – Chief Market Analyst for ConquertheMummy.com  © 2015-2019, “Nonlinear trading signals that matter in bitcoin trading.”