2-month (approx.) focus chart.
Current market Predictions:
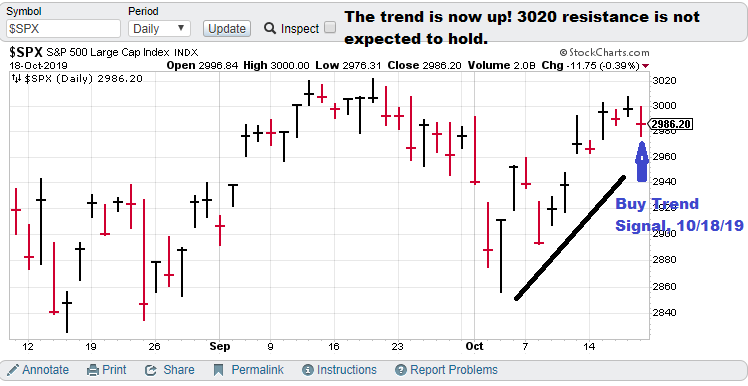
$SPX (S&P 500), non-linear model indicates that the trading trend is now up for this index. Today (10/18/19) is the signal day. The closing price on Monday is the TTP (Theoretical Transaction Day).
Current price for CTM research (signals), $15,000 per quarter for the S&P 500 “quick march” nonlinear model. It is a faster model more optimized for options trading.
Model notes: My data provider seemed to go AWOL on my bitcoin data for almost a week. I am taking this opportunity to optimize the nonlinear models on the far more popular S&P 500 index. The model signals are from our basic model.
What? On my last post I indicated that Ukraine impeachment initiative is a progressive plot to weaken Biden’s presidential bid, which it has done in terms of reducing fund raising and voter poll results. Warren seems to be benefitting, moving to front runner status. However, she has another issue. Electability.
Note: The following comments are based on using technical analysis to ‘flesh out’ our nonlinear trading signals. TTP (Theoretical Transaction Day) is defined as the closing price on the day following the signal day.
Nonlinear Trading Themes:
- S&P 500 Index forecast ($SPX): The trading trend is pointed skyward. Nonlinear indicators expect the index to break through the 3020 level.
GH Garrett – Chief Market Analyst for ConquertheMummy.com © 2015-2019, “Nonlinear trading signals that matter in stock index and S&P 500 index trading.”