2-month (approx.) focus chart.
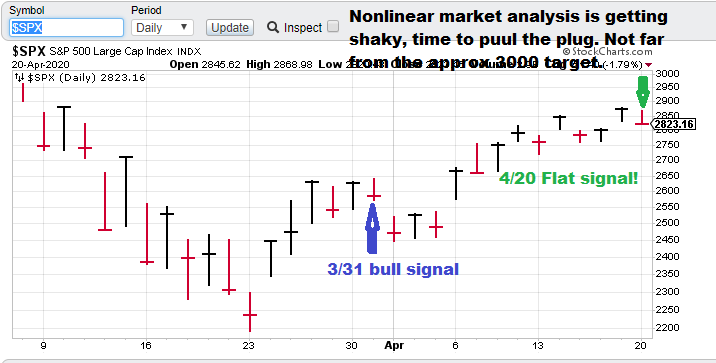
Current S&P 500 Prediction: $SPX (S&P 500), flat.
Model notes: System is generating a flat signal today. In the past, I have pretty much left the flat signals out in favor of having a directional opinion. However, this train of logic has changed with the most current version.
Note: The following comments are based on using technical analysis to ‘flesh out’ our nonlinear trading signals. TTP (Theoretical Transaction Day) is defined as the closing price on the trading day following the signal day.
Nonlinear Trading Themes:
S&P 500 forecast (Flat, SPX): The market made a decent run at our non-linear projection. However, recent momentum moderation, the models are detecting problems ahead, but not enough to issue an outright sell. So the play is to step aside for now and look for a better re-entry
Current price for CTM research (signals), $15,000 per quarter for the S&P 500 “fast” nonlinear model. The faster model is more optimized for options trading.
Master Sergeant Bilko (the movie version) said, “I like a sporting event in which I know the outcome beforehand, it’s more organized.”
GH Garrett – Chief Market Analyst for ConquertheMummy.com © 2015-2020, “Nonlinear trading signals that matter in stock index and S&P 500 trading. Determine the future direction of the S&P and trading becomes much less complex.”