2-month (approx.) focus chart.
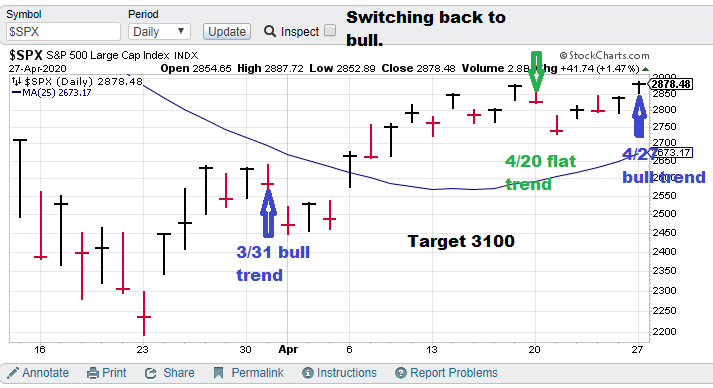
Current S&P 500 Prediction: $SPX (S&P 500), Bull.
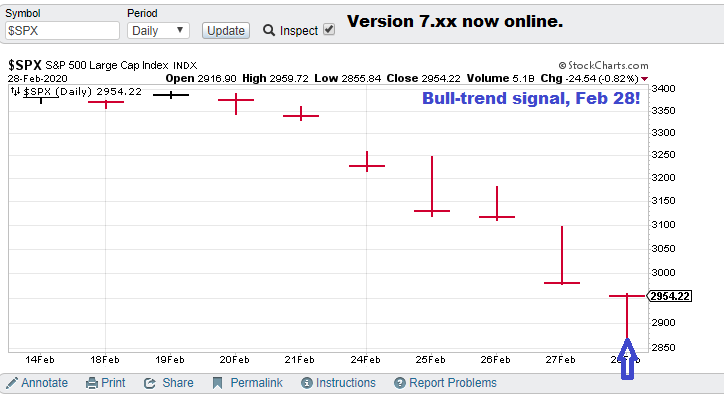
Model notes: The system stayed bullish but the market has been rangebound, could this be it?
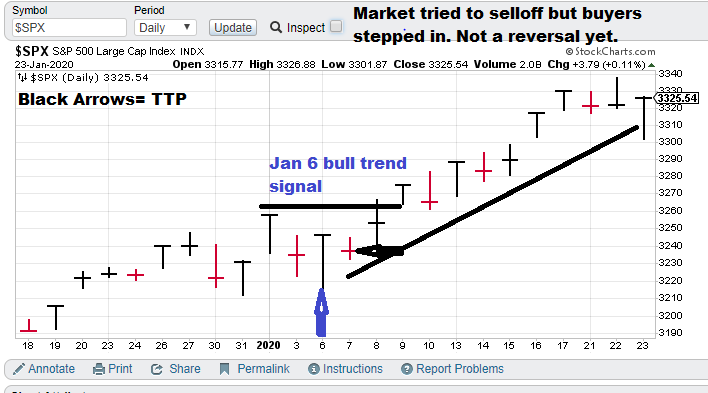
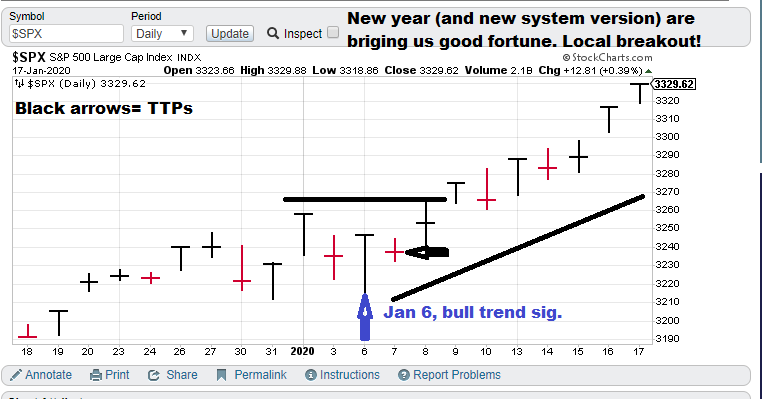
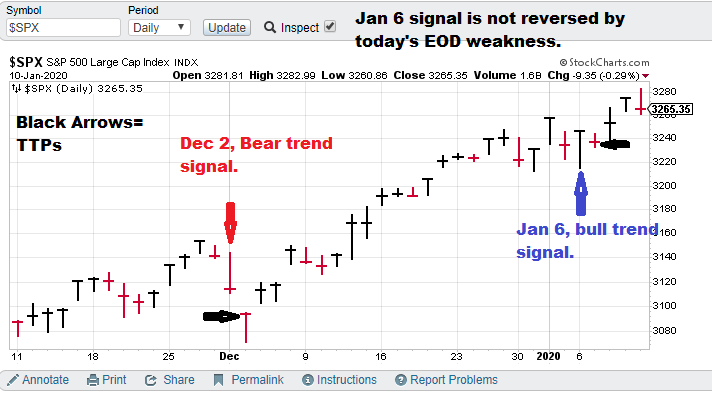
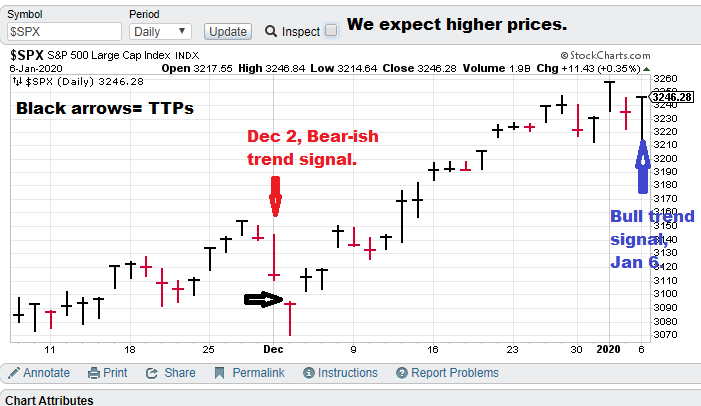
Note: The following comments are based on using technical analysis to ‘flesh out’ our nonlinear trading signals. TTP (Theoretical Transaction Day) is defined as the closing price on the trading day following the signal day.
Nonlinear Trading Themes:
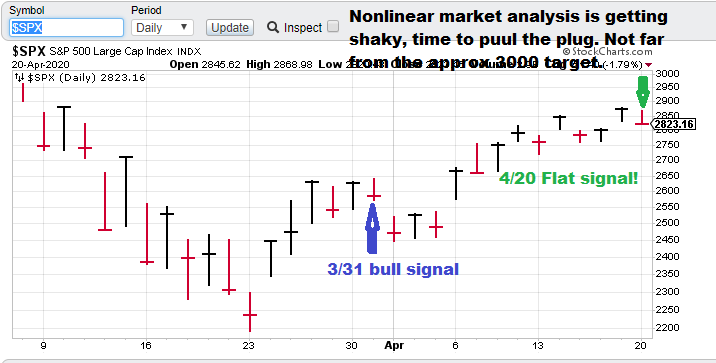
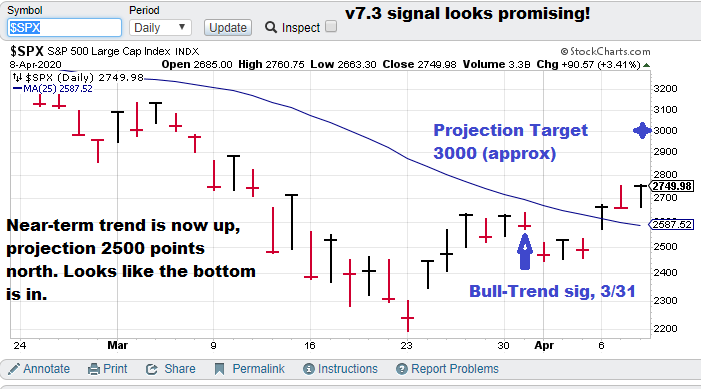
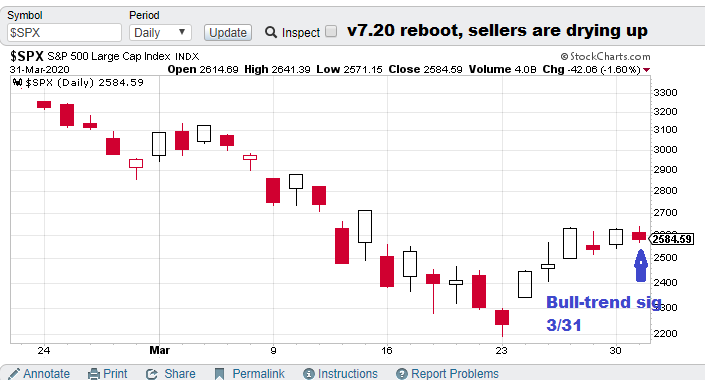
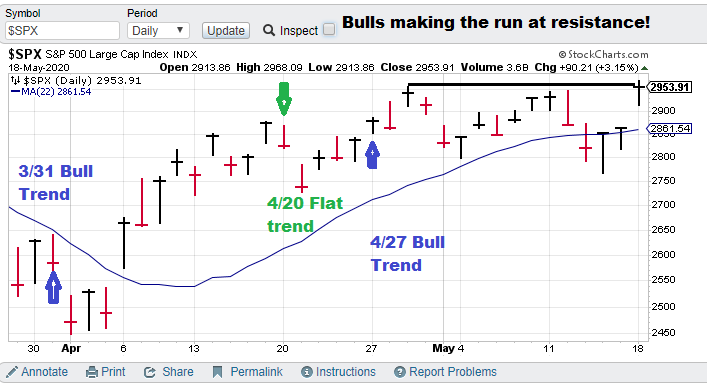
S&P 500 forecast (Bullish, SPX): The market took some hits last week. Fed Powell’s comments seemed rather dour comments were not helpful. Hot-handed fund manager David Tepper warned of overvaluation concerns (you got to be careful of fund managers pronouncements, these guys usually are expected to be in and they use the old motto ‘buy the cannons, sell the trumpets’ motto). Everyone knows the shutdown, but now the county is restarting. The market tends to look ahead.
Current price for CTM research (signals), $15,000 per quarter for other market signals (interest rates or something else). This model is more optimized to short-term market action. Option, anyone?
Master Sergeant Bilko (the movie version) said, “I like a sporting event in which I know the outcome beforehand, it’s more organized.”
GH Garrett – Chief Market Analyst for ConquertheMummy.com © 2015-2020, “Use nonlinear research to help determine the future direction of the S&P and trading can become much less complex.”