2-month (approx.) focus chart.
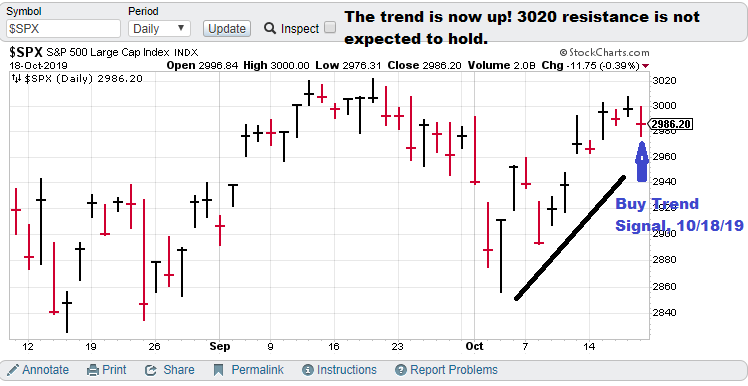
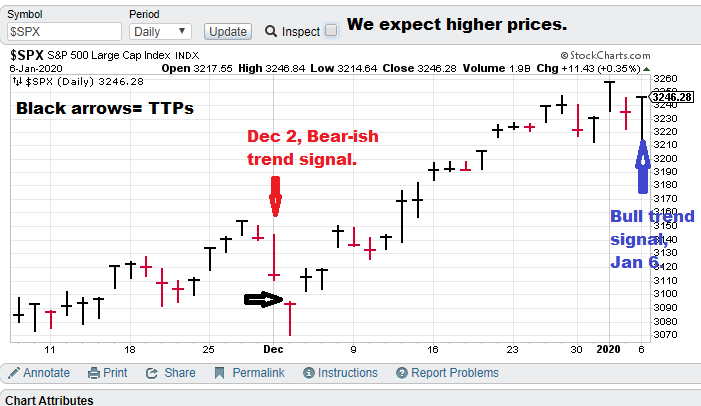
Current S&P 500 Prediction (slow model): $SPX (S&P 500), Bull-trend signal (01/06/20), TTP= Close of Tuesday
Previous market prediction:
$SPX (S&P 500), Bear-trend signal (12/02/19), TTP= 3093.20
Current price for CTM research (signals), $15,000 per quarter for the S&P 500 “fast” nonlinear model. The faster model is more optimized for options trading.
Model notes: The October signal was great but the December signal not so much. Chaotic based systems tend to be carefully balanced, still market gyrations can “fake out” a sophisticated system. We will continue to ponder the signal action versus the market action. I continue to have faith in chaotic trend / nonlinear trend analysis approach. Anyway, more to follow.
What does the S&P 500 say about … the drone strike on Soleimani? Friday’s news caused a sell-off in stocks but there was limited follow through. The news is not accurately reflecting the affection the general population had for this guy and the government is really looking to save face. They do not have a winning hand.
Note: The following comments are based on using technical analysis to ‘flesh out’ our nonlinear trading signals. TTP (Theoretical Transaction Day) is defined as the closing price on the day following the signal day.
Nonlinear Trading Themes:
S&P 500 forecast (Bullish, SPX): At this point we expect the market to quickly recover from the geo-political turbulence from the drone strike and resume the upward move. Look for a near-term breakout to signal the uptrend is back on.
Master Sergeant Bilko (the movie version) said, “I like a sporting event in which I know the outcome beforehand, it’s more organized.
”GH Garrett – Chief Market Analyst for ConquertheMummy.com © 2015-2019, “Nonlinear trading signals that matter in stock index and S&P 500 trading. Determine the future direction of the S&P and trading becomes much less complex.”