2-month (approx.) focus chart.
Current S&P 500 Prediction: $SPX (S&P 500), Bull.
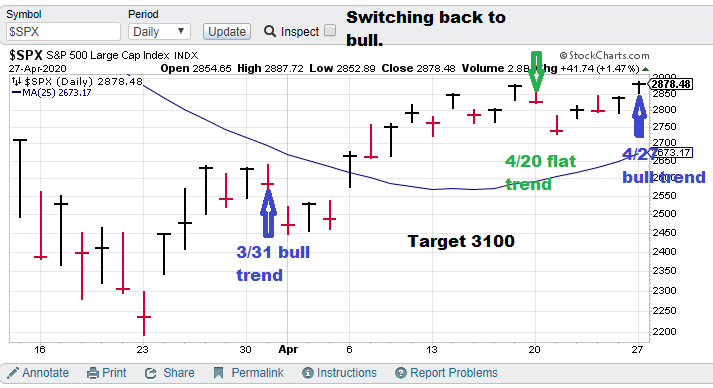
Model notes: The system is starting to like the trend better now. So, here we go.
Note: The following comments are based on using technical analysis to ‘flesh out’ our nonlinear trading signals. TTP (Theoretical Transaction Day) is defined as the closing price on the trading day following the signal day.
Nonlinear Trading Themes:
S&P 500 forecast (Flat, SPX): The system now projects the market will hit 3100.00. The states are now going to try to come back online at their individual populations. If you watch financial news networks it is pretty downcast as pundits are pretty much forced to project the current market metric compared to one quarter ago. But this is a known factor, the COVID virus and the following “lockdown” are obvious factors and fully discounted by the market participants. Using nonlinear analysis is one way to help get a handle on the future.
Current price for CTM research (signals), $15,000 per quarter for the S&P 500 “fast” nonlinear model. The faster model is more optimized for options trading.
Master Sergeant Bilko (the movie version) said, “I like a sporting event in which I know the outcome beforehand, it’s more organized.”
GH Garrett – Chief Market Analyst for ConquertheMummy.com © 2015-2020, “Nonlinear trading signals that matter in stock index and S&P 500 trading. Determine the future direction of the S&P and trading becomes much less complex.”