2-month (approx.) focus chart.
Current S&P 500 Prediction: $SPX (S&P 500), Bull-trend signal (v7.2), (03/31/20).
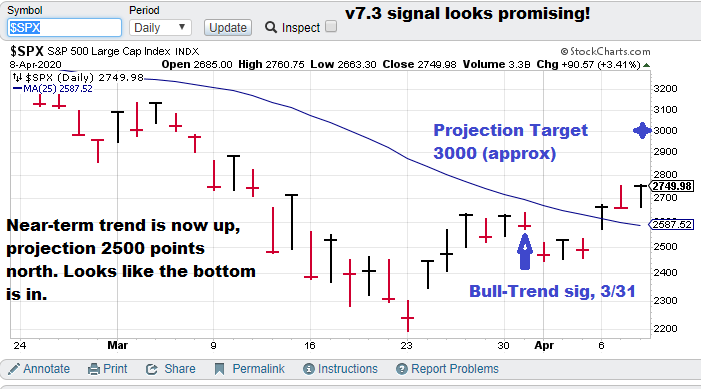
Model notes: Today’s post was published on 4/9 (morning) so the chart is only updated to the closing price of 4/8. The amazing thing is that we finished the v7.3 and now have the ability to show (periodically) projections! This goes along with our bold goal to make trading simpler by knowing the future of the S&P 500.
Note: The following comments are based on using technical analysis to ‘flesh out’ our nonlinear trading signals. TTP (Theoretical Transaction Day) is defined as the closing price on the trading day following the signal day.
Nonlinear Trading Themes:
S&P 500 forecast (Bullish, SPX): The non-linear outlook is pretty good. The recent signal is bullish and the projection is still pointing higher (to the tune of 2500). On the linear side, prices have broken above MA25, indicating the near-term trend is up. Technically the March 23 low appears to be a “V” shaped bottom. The news outlets have managed scare all the people they can into selling. Only the buyers are left. Beware left-leaning news organizations as they have a vested interest (anti-Trump) to portray a bleak future.
Current price for CTM research (signals), $15,000 per quarter for the S&P 500 “fast” nonlinear model. The faster model is more optimized for options trading.
Master Sergeant Bilko (the movie version) said, “I like a sporting event in which I know the outcome beforehand, it’s more organized.”
GH Garrett – Chief Market Analyst for ConquertheMummy.com © 2015-2020, “Nonlinear trading signals that matter in stock index and S&P 500 trading. Determine the future direction of the S&P and trading becomes much less complex.”