2-month (approx.) focus chart.
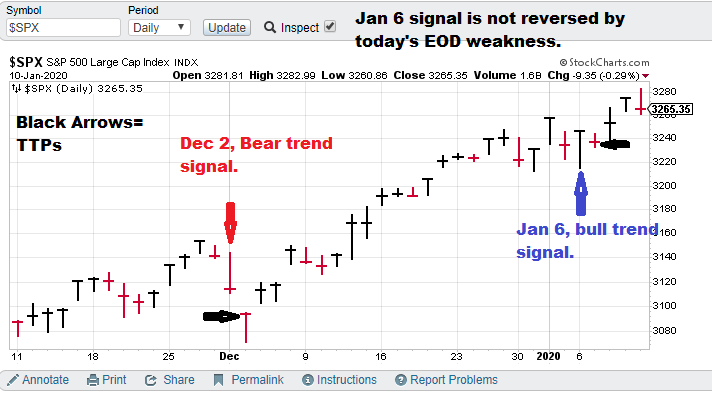
Current S&P 500 Prediction (slow model): $SPX (S&P 500), Bull-trend signal (01/06/20), TTP= Close of Tuesday
Previous market prediction:
$SPX (S&P 500), Bear-trend signal (12/02/19), TTP= 3093.20
Current price for CTM research (signals), $20,000 per quarter for the S&P 500 “fast” nonlinear model. The faster model is more optimized for options trading.
Model notes: The Jan 6 signal has us back on track. I continue to have faith in chaotic trend / nonlinear trend analysis approach. Anyway, more to follow.
What does the S&P 500 say about … WWIII with Iran? The main stream media threw out the phrase WWIII but the S&P 500 is telling us this is overblown. Iran simply is not the equivalent of Nazi Germany plus Imperial Japan circa 1940.
Note: The following comments are based on using technical analysis to ‘flesh out’ our nonlinear trading signals. TTP (Theoretical Transaction Day) is defined as the closing price on the day following the signal day.
Nonlinear Trading Themes:
S&P 500 forecast (Bullish, SPX): The blue-chip index has moved north since the signal, even beyond the new year’s closing high (Jan. 2). Today’s weakness did not close below the previous Jan 2 close, so technically the uptrend is still “on.” I suspect that some traders wanted to lighten up before the weekend.
Master Sergeant Bilko (the movie version) said, “I like a sporting event in which I know the outcome beforehand, it’s more organized.”
GH Garrett – Chief Market Analyst for ConquertheMummy.com © 2015-2020, “Nonlinear trading signals that matter in stock index and S&P 500 trading. Determine the future direction of the S&P and trading becomes much less complex.”