2-month (approx.) focus chart.
Current market Predictions:
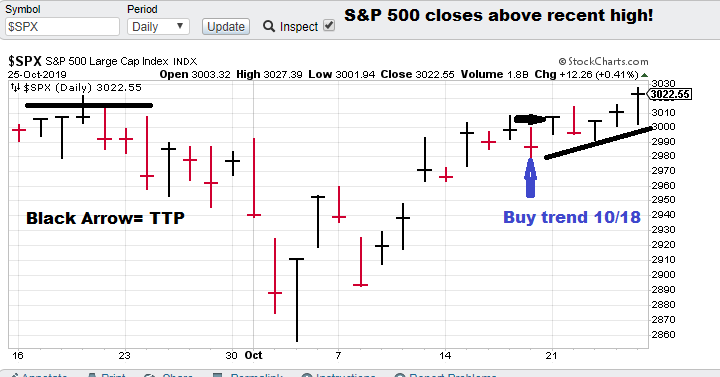
$SPX (S&P 500), non-linear model indicates that the trading trend is now up for this index. Today (10/18/19) is the signal day. The closing price on Monday (10/21). TTP (Theoretical Transaction Day) = 3006.72.
Current price for CTM research (signals), $15,000 per quarter for the S&P 500 “fast” nonlinear model. The faster model is more optimized for options trading.
Model notes: The model is looking good. Price closed at a new recent high 5 trading days after signal date. Chaotic trend analysis is giving us the edge in time-series prediction.
What? The impeachment effort is starting to look more like the Crazy Train. So far, it’s not holding the market back.
Note: The following comments are based on using technical analysis to ‘flesh out’ our nonlinear trading signals. TTP (Theoretical Transaction Day) is defined as the closing price on the day following the signal day.
Nonlinear Trading Themes:
- S&P 500 Index forecast (SPX): The trading trend made significant technical progress this week with Friday’s breakout close. Nonlinear indicators are still bullish.
GH Garrett – Chief Market Analyst for ConquertheMummy.com © 2015-2019, “Nonlinear trading signals that matter in stock index and S&P 500 index trading.”