3-month focus chart.
Current market Predictions:
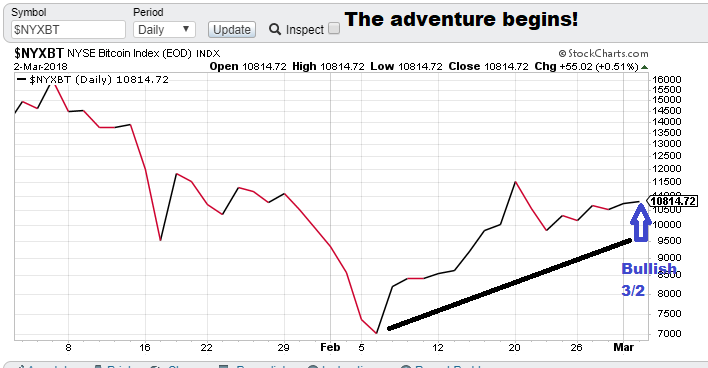
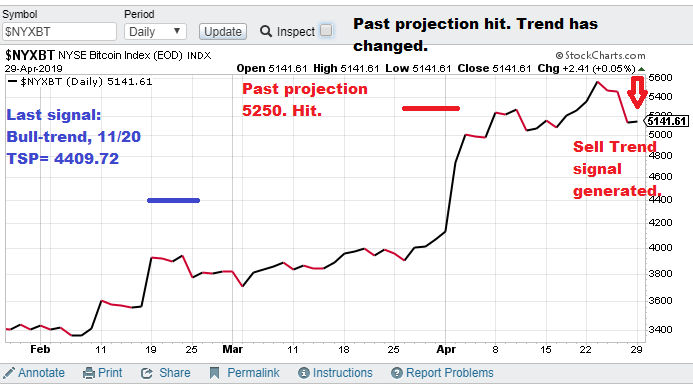
- $NYXBT (Bitcoin), 4/29/18, bear trend signal. TSP (4/30) = waiting. Downside 3-month bitcoin price forecast = Calculating.
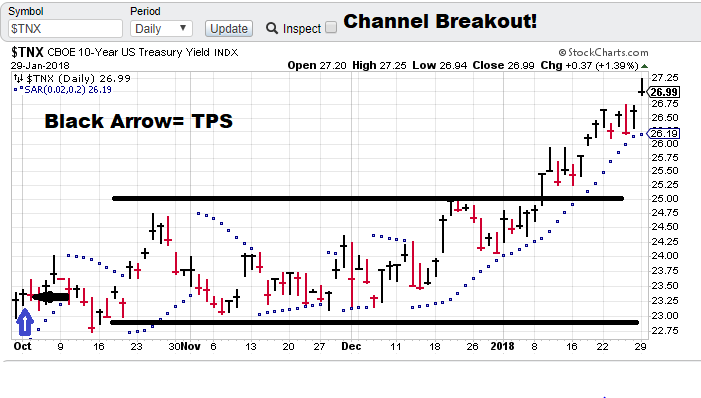
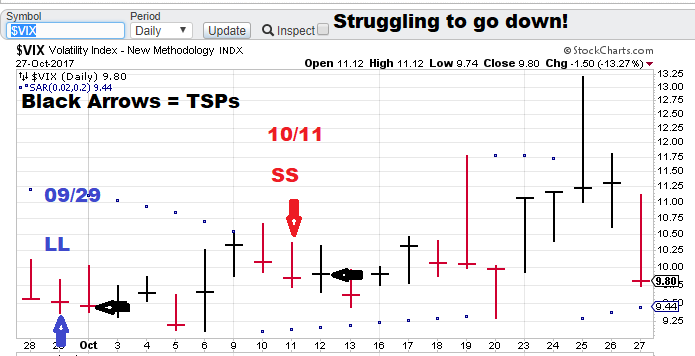
- $VIX signal, waiting. This is a new signal current trend is down. We are waiting for the first signal to start posting a chart.
Current price for a 4 symbol package = $7,500 quarterly.
Model notes: Bitcoin trend change signal comes after hitting our upside projection. The sell TSP should be higher than the entry (assuming tomorrows close is near today’s). So the model is still in synch with the market. The downside projection will be posted later. We plan to add a Vix signal as well. Volatility is another strange non-traditional market that should be benefitted by looking through the lens nonlinear analysis.
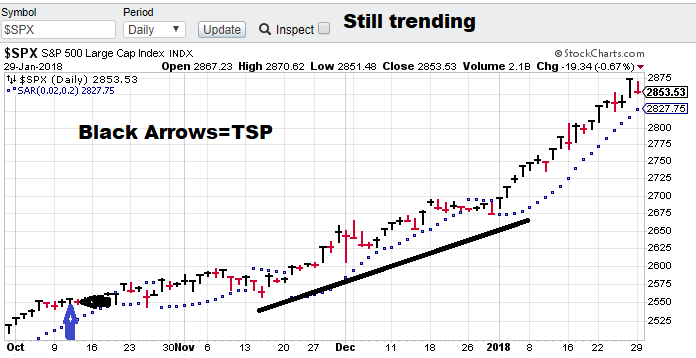
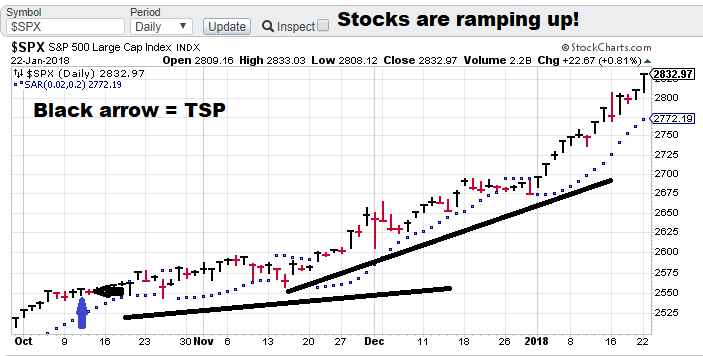
Note: The following comments are based on using technical analysis to ‘flesh out’ our nonlinear trading signals. TSP is defined as the closing price on the day following the signal day.
Nonlinear Trading Themes:
- Bitcoin forecast ($NYXBT): Now we are looking for the cryptocurrency to move lower. The market has hit the upside projection and nonlinear analysis forecasts more weakness ahead.
- $VIX forecast: Awaiting a fresh signal (this is a new venture). The market has been beaten down in the wake of S&P 500 strength. Currently the index habitats in the 12-13 range.
GH Garrett – Chief Market Analyst for ConquertheMummy.com © 2015-2019, “Nonlinear trading signals that matter in bitcoin trading.”