2-month (approx.) focus chart.
Current Market Prediction (slow model):
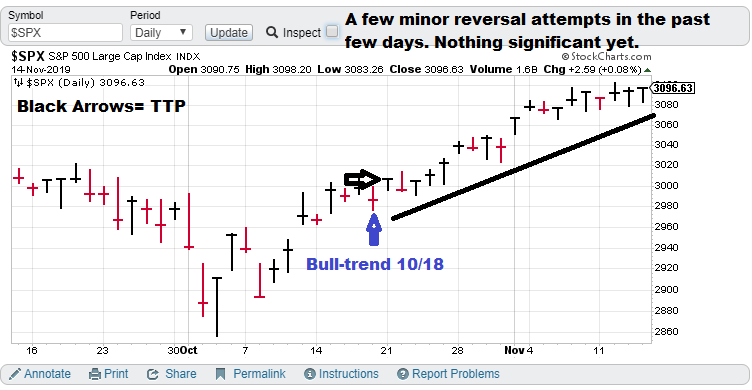
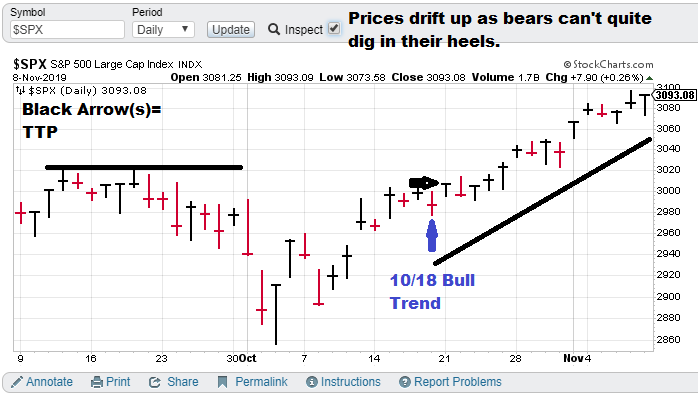
$SPX (S&P 500), Bull-trend signal (10/18/19) with TTP= 3006.72.
Current price for CTM research (signals), $15,000 per quarter for the S&P 500 “fast” nonlinear model. The faster model is more optimized for options trading.
Model notes: Todays S&P 500 small-scale reversal (less than 2 points) may be more sympathetic to the DJIA losing ground on the back of Home Depot losses (-5% plus). The model seems to still be in-sync with the current t uptrend. We are just a couple points off the 2-month closing high. Chaotic trend / nonlinear trend analysis is giving us the glimpse at the future ahead.
What is the S&P 500 signaling about current events? We have discussed this about a week now and the major index continues to drift upwards. Today’s action continues to show the market is not really concerned. The side topic of an escalated “trade war” with China
Note: The following comments are based on using technical analysis to ‘flesh out’ our nonlinear trading signals. TTP (Theoretical Transaction Day) is defined as the closing price on the day following the signal day.
Nonlinear Trading Themes:
- S&P 500 forecast (SPX): The S&P basically drifted higher over the last couple of days. Today’s 2 pt downside reversal is pretty tame considering action of the last 2 months. We keep saying (in various ways) that the bears just don’t seem to be able to pull a meaningful raid off. The impeachment proceedings are not producing enough angst among market participants to be a bearish factor (lack-luster testimony and Republican control of the Senate are contributing to the peace). Technical trend is still up. Nonlinear / Chaotic indicators are still bullish. We are keeping a lookout in case darker clouds arise.
GH Garrett – Chief Market Analyst for ConquertheMummy.com © 2015-2019, “Nonlinear trading signals that matter in stock index and S&P 500 trading. Determine the direction of the S&P and trading becomes much less complex.”
Master Sergeant Bilko (the movie version) said, “I like a sporting event in which I know the outcome beforehand, it’s more organized.”