2-month (approx) focus chart.
Current Market Forecast (slow model):
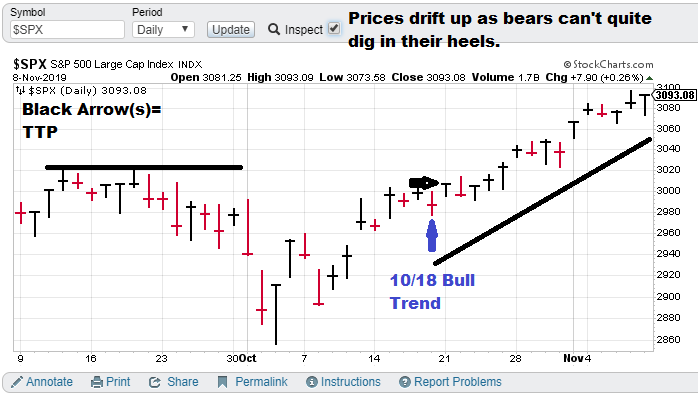
$SPX (S&P 500), Bull-trend signal (10/18/19) with TTP= 3006.72.
Current price for CTM research (signals), $15,000 per quarter for the S&P 500 “fast” nonlinear model. The faster model is more optimized for options trading.
Model notes: S&P 500 closes at the high of the week, sellers attempt a couple reversal attempts but couldn’t get it going. Model still in-sync. Chaotic trend / nonlinear trend analysis is giving us the glimpse at the future trend.
What? Have a great Veterans Day!
Note: The following comments are based on using technical analysis to ‘flesh out’ our nonlinear trading signals. TTP (Theoretical Transaction Day) is defined as the closing price on the day following the signal day.
Nonlinear Trading Themes:
- S&P 500 forecast (SPX): Stocks have broken through mid-October highs and we don’t see a serious technical reversal yet. Technical trend is still up. Nonlinear / Chaotic indicators are still bullish.
GH Garrett – Chief Market Analyst for ConquertheMummy.com © 2015-2019, “Nonlinear trading signals that matter in stock index and S&P 500 trading.”