11/5/19 S&P 500 posts gains with a nonlinear nod!
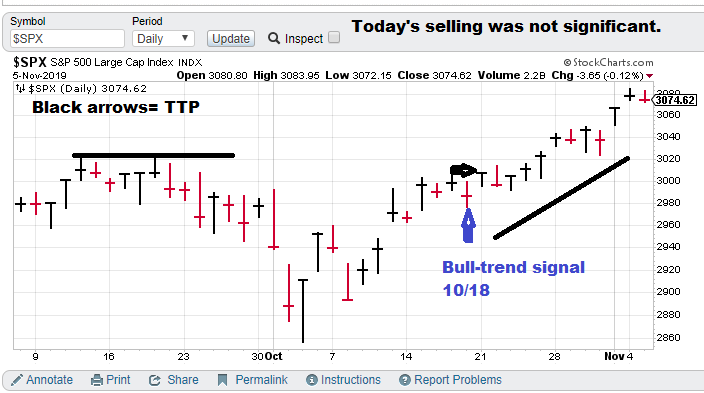
2-month (approx.) focus chart.
Current Market Predictions:
$SPX (S&P 500), Bull-trend signal (10/18/19) with TTP= 3006.72.
Current price for CTM research (signals), $15,000 per quarter for the S&P 500 “fast” nonlinear model. The faster model is more optimized for options trading.
Model notes: The model is in-synch with the market. Price action for the bull-trend is still upward with the most current close above the TTP. Chaotic trend / nonlinear trend analysis is giving us the edge in time-series prediction.
What? The Democratic party continues to struggle with selecting a presidential candidate. 3 top tier contenders and dark horse Pete Buttigieg (he is advancing from the lower tier).
Note: The following comments are based on using technical analysis to ‘flesh out’ our nonlinear trading signals. TTP (Theoretical Transaction Day) is defined as the closing price on the day following the signal day.
Nonlinear Trading Themes:
- S&P 500 forecast (SPX): The bullish trend signal took some minor selling today, but the bears lacked conviction. Technical trend is still up. Nonlinear indicators are still bullish.
GH Garrett – Chief Market Analyst for ConquertheMummy.com © 2015-2019, “Nonlinear trading signals that matter in stock index and S&P 500 trading.”