Current Model positions:
- $TNX (rates) bullish signal date = 10/02, TSP = 23.34
- SPY bullish signal date= 10/11, TSP = 254.64
Model notes: The models continue the to track the trends pretty well. I am placing this post in the morning before the 9:30am (EST) market open. Prices are through the end of day of Jan 16. Due to a change in my work schedule, I will have to place more early morning posts versus my usual late-night posts. By the way, we are working on Bitcoin signals too! Let’s look at the charts.
Note: The following comments are based on using technical analysis to ‘flesh out’ our nonlinear trading signals. TSP is defined as the closing price on the day following the signal day.
Nonlinear Trading Themes:
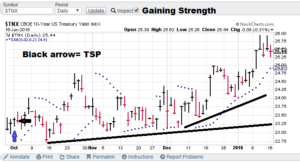 Bullish Yields ($TNX): Rates are starting to ramp up. The intellectual argument of an improving economy have been in place for a year now, finally the bond market seems to be smelling it. NL models have the trend as up!
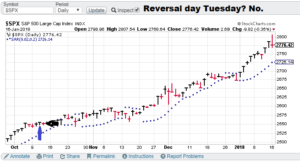 Bullish Trend Stocks (SPY): Tuesday’s move higher then closing lower was technically a downside reversal day. But is it significant. Is it a reversal of the trend? Not according to the nonlinear models, bluechip trend is still up!


Premium Research notes:
Observation: We now have the new fee structure in place (check the “Fees” tab for details). Get your independent research here, put my 25+ years of model building experience to work for you!
Take a minute to peruse the US Equities tab. I posted the S&P 500 trading signals postmortem for the recent March-April time period (approx. as it took about a week to generate a signal at the beginning). Plus 134 Points. Great stuff!
Take a minute to check out the Forex tab on our website. I am posting the recent US Dollar May-June signals. No whipsaws and playing the surprise Brexit vote just right. Great stuff!
Take a minute to take a minute to click on our bond trading tab. Our signals took the profits in the early month while holding the long interest rates position later. It never sold rates, hinting at higher rates to come. The TBT went higher outside our test window. A nice tip-off for the future!
Check out the energy tab. We tracked crude during the run up to the US presidential election. There was plenty negativity with a surprise ending. See how nonlinear analysis walked us through it!
GH Garrett – Chief Market Analyst for ConquertheMummy.com © 2015-2017, “Nonlinear trading signals that matter in VIX trading.”