2-month (approx.) focus chart.
Current S&P 500 Prediction (slow model): $SPX (S&P 500), Bear-trend signal (12/02/19), TTP= 3093.20
Previous market prediction:
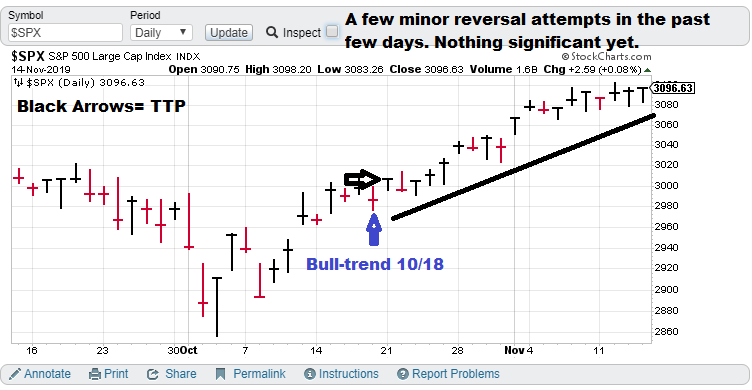
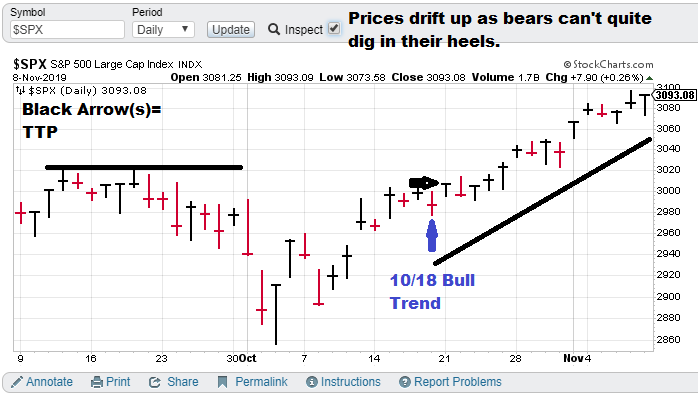
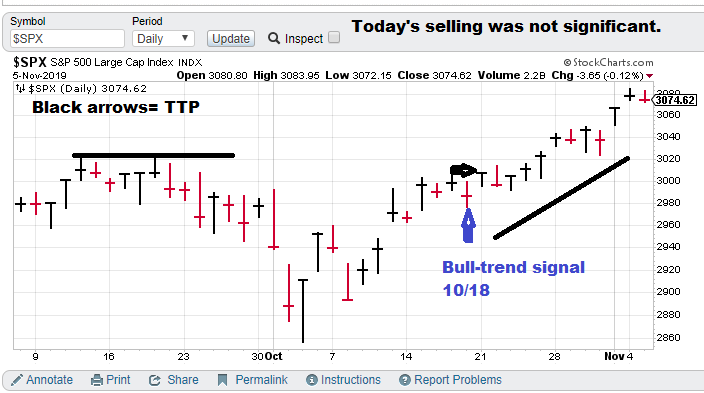
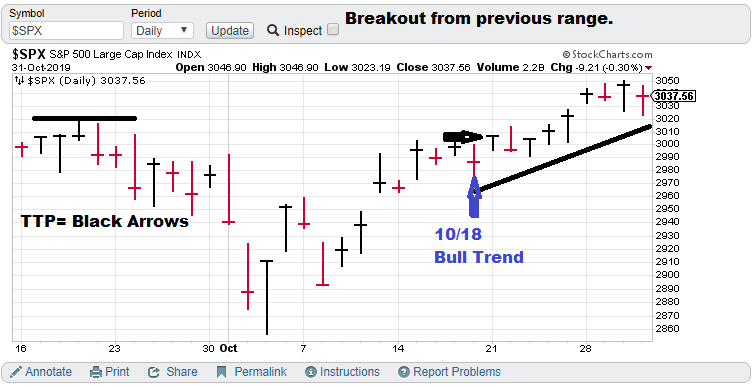
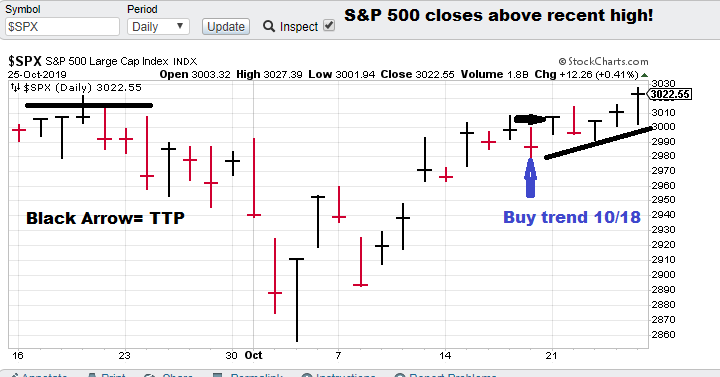
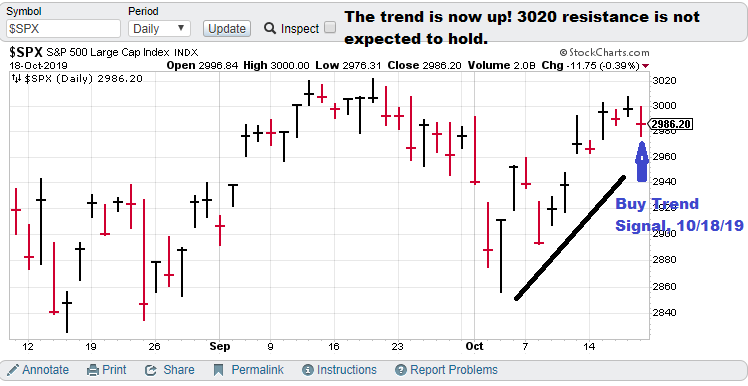
$SPX (S&P 500), Bull-trend signal (10/18/19) with TTP= 3006.72
Current price for CTM research (signals), $15,000 per quarter for the S&P 500 “fast” nonlinear model. The faster model is more optimized for options trading.
Model notes: The October signal was rewarded by a relatively painless (meaning limited reactions to the trend) 90 points in short order. The December signal looks to be more of a knife fight, as our TTP day came at the END of a significant two-day sell off, not before it, thus putting the current TTP underwater immediately. (note: the faster signal came before). I look forward to the fight, we have the Chaotic trend / nonlinear trend analysis to guide us through this.
What does the S&P 500 say about … impeachment? Friday’s move up suggests the vote next week is not troubling.
Note: The following comments are based on using technical analysis to ‘flesh out’ our nonlinear trading signals. TTP (Theoretical Transaction Day) is defined as the closing price on the day following the signal day.
Nonlinear Trading Themes:
S&P 500 forecast (Bearish, SPX): Let me reiterate the obvious first: nonlinear / chaotic systems have turned negative. So we expect a trading range but really weaker. to a down movement. Friday’s up-day puts the market in a vulnerable situation. The three-day rally is up against the previous closing high on Nov 27. So limited upside with indications of lower prices should have the bears considering their plays.
Master Sergeant Bilko (the movie version) said, “I like a sporting event in which I know the outcome beforehand, it’s more organized.”
GH Garrett – Chief Market Analyst for ConquertheMummy.com © 2015-2019, “Nonlinear trading signals that matter in stock index and S&P 500 trading. Determine the future direction of the S&P and trading becomes much less complex.”