All posts by GHGarrett

12/6/19 This signal turned into a knife fight!

2-month (approx.) focus chart.

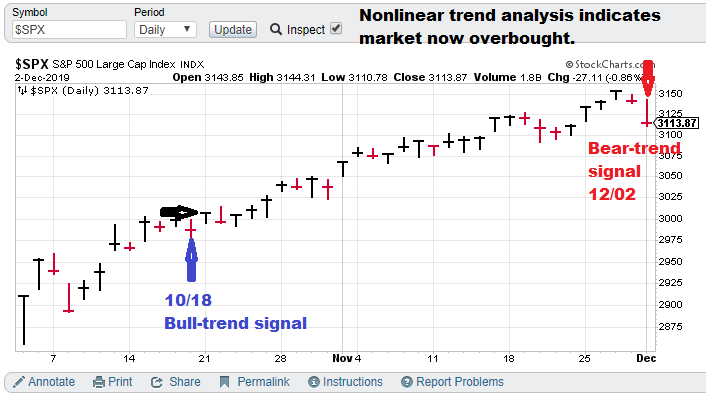
Current S&P 500 Prediction (slow model): $SPX (S&P 500), Bear-trend signal (12/02/19), TTP= 3093.20

Previous market prediction:

$SPX (S&P 500), Bull-trend signal (10/18/19) with TTP= 3006.72

Current price for CTM research (signals), $15,000 per quarter for the S&P 500 “fast” nonlinear model. The faster model is more optimized for options trading.

Model notes: The October signal was rewarded by a relatively painless (meaning limited reactions to the trend) 90 points in short order. The December signal looks to be more of a knife fight, as our TTP day came at the END of a significant two-day sell off, not before it, thus putting the current TTP underwater immediately. (note: the faster signal came before). I look forward to the fight, we have the Chaotic trend / nonlinear trend analysis to guide us through this.

What does the S&P 500 say about … impeachment? Friday’s move up suggests the vote next week is not troubling.

Note: The following comments are based on using technical analysis to ‘flesh out’ our nonlinear trading signals. TTP (Theoretical Transaction Day) is defined as the closing price on the day following the signal day.

Nonlinear Trading Themes:

S&P 500 forecast (Bearish, SPX): Let me reiterate the obvious first:  nonlinear / chaotic systems have turned negative. So we expect a trading range but really weaker.  to a down movement. Friday’s up-day puts the market in a vulnerable situation. The three-day rally is up against the previous closing high on Nov 27. So limited upside with indications of lower prices should have the bears considering their plays.

Master Sergeant Bilko (the movie version) said, “I like a sporting event in which I know the outcome beforehand, it’s more organized.”

GH Garrett – Chief Market Analyst for ConquertheMummy.com  © 2015-2019, “Nonlinear trading signals that matter in stock index and S&P 500 trading. Determine the future direction of the S&P and trading becomes much less complex.”
12/2/19 We had to get a bear signal sometime.

2-month (approx.) focus chart.

Current Market Prediction (slow model):

$SPX (S&P 500), Bear-trend signal (12/02/19), TTP= next day’s close.

Previous market prediction:

$SPX (S&P 500), Bull-trend signal (10/18/19) with TTP= 3006.72.

Current price for CTM research (signals), $15,000 per quarter for the S&P 500 “fast” nonlinear model. The faster model is more optimized for options trading.

Model notes: We have had a nice run and in terms of a longer time frame, higher prices be in the future, but according to our more trading-oriented time frame we expect weakness in the blue-chip indicator. We envision our signals being used by options traders. The Chaotic trend / nonlinear trend analysis is giving us the glimpse at the future ahead.

What is the S&P 500 signaling about … the impeachment? I do not think the bear-trend signal is pointing to some type of impeachment strength, but more that the market is now overbought and some type of reversal is due.

Note: The following comments are based on using technical analysis to ‘flesh out’ our nonlinear trading signals. TTP (Theoretical Transaction Day) is defined as the closing price on the day following the signal day.

Nonlinear Trading Themes:

  • S&P 500 forecast (Bearish, SPX): The pleasant Thanksgiving holiday has given rise to the market now being susceptible to overbought selling. It is not unfair to question how substantial this pullback will be (considering the strength of the previous uptrend) however, the signal suggests that bulls step aside and wait for an upside reversal in the future.

GH Garrett – Chief Market Analyst for ConquertheMummy.com  © 2015-2019, “Nonlinear trading signals that matter in stock index and S&P 500 trading. Determine the future direction of the S&P and trading becomes much less complex.”

Master Sergeant Bilko (the movie version) said, “I like a sporting event in which I know the outcome beforehand, it’s more organized.”

11/25/19 3-day modest selloff reverses to the upside!

2-month (approx.) focus chart.

Current Market Prediction (slow model):

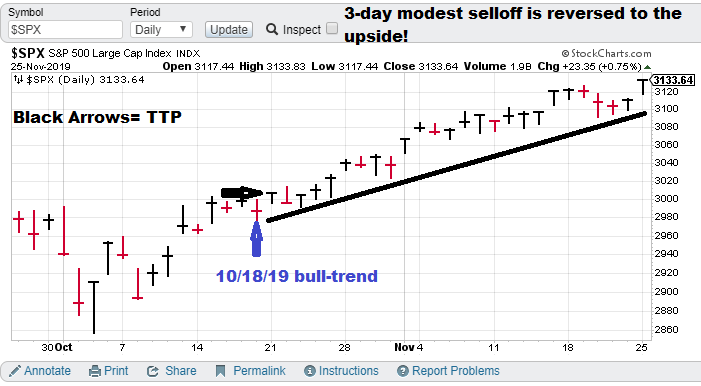
$SPX (S&P 500), Bull-trend signal (10/18/19) with TTP= 3006.72.

Current price for CTM research (signals), $15,000 per quarter for the S&P 500 “fast” nonlinear model. The faster model is more optimized for options trading.

Model notes: The model did not get faked out with the modest 3-day bout of selling, thus leaving us in position to participate in the move to new closing highs for the current signal.  We do have a short swing trading time frame but sticking with an extended trend is a hallmark of a good trading system. We envision our signals being used by options traders, who can hit profit targets and take new bullish trades during the signal. The Chaotic trend / nonlinear trend analysis is giving us the glimpse at the future ahead.

What is the S&P 500 signaling about … The impeachment? The market does not seem concerned that the Dems have a winning hand in this. The hearings are not capturing the public imagination.

Note: The following comments are based on using technical analysis to ‘flesh out’ our nonlinear trading signals. TTP (Theoretical Transaction Day) is defined as the closing price on the day following the signal day.

Nonlinear Trading Themes:

  • S&P 500 forecast (SPX): The S&P underwent a modest 3-day selloff but the bears really were not able to drop the hammer. The Thanksgiving holiday can be a time of lighter volume and reducing bearish exposure ahead of the holiday seemed to the theme for the day. Basic technicals are positive as of the day and so are the Nonlinear / Chaotic indicators that originally put us in position.

GH Garrett – Chief Market Analyst for ConquertheMummy.com  © 2015-2019, “Nonlinear trading signals that matter in stock index and S&P 500 trading. Determine the direction of the S&P and trading becomes much less complex.”
Master Sergeant Bilko (the movie version) said, “I like a sporting event in which I know the outcome beforehand, it’s more organized.”

11/19/19 S&P reverses, barely.

2-month (approx.) focus chart.

Current Market Prediction (slow model):

$SPX (S&P 500), Bull-trend signal (10/18/19) with TTP= 3006.72.

Current price for CTM research (signals), $15,000 per quarter for the S&P 500 “fast” nonlinear model. The faster model is more optimized for options trading.

Model notes: Todays S&P 500 small-scale reversal (less than 2 points) may be more sympathetic to the DJIA losing ground on the back of Home Depot losses (-5% plus). The model seems to still be in-sync with the current t uptrend. We are just a couple points off the 2-month closing high.  Chaotic trend / nonlinear trend analysis is giving us the glimpse at the future ahead.

What is the S&P 500 signaling about current events? We have discussed this about a week now and the major index continues to drift upwards. Today’s action continues to show the market is not really concerned. The side topic of an escalated “trade war” with China

Note: The following comments are based on using technical analysis to ‘flesh out’ our nonlinear trading signals. TTP (Theoretical Transaction Day) is defined as the closing price on the day following the signal day.

Nonlinear Trading Themes:

  • S&P 500 forecast (SPX): The S&P basically drifted higher over the last couple of days.  Today’s 2 pt downside reversal is pretty tame considering action of the last 2 months.  We keep saying (in various ways) that the bears just don’t seem to be able to pull a meaningful raid off. The impeachment proceedings are not producing enough angst among market participants to be a bearish factor (lack-luster testimony and Republican control of the Senate are contributing to the peace). Technical trend is still up. Nonlinear / Chaotic indicators are still bullish. We are keeping a lookout in case darker clouds arise.

GH Garrett – Chief Market Analyst for ConquertheMummy.com  © 2015-2019, “Nonlinear trading signals that matter in stock index and S&P 500 trading. Determine the direction of the S&P and trading becomes much less complex.”
Master Sergeant Bilko (the movie version) said, “I like a sporting event in which I know the outcome beforehand, it’s more organized.”

11/14/19 Several minor reversal attempt recently, nothing significant yet.

2-month (approx) focus chart.

Current Market Prediction (slow model):

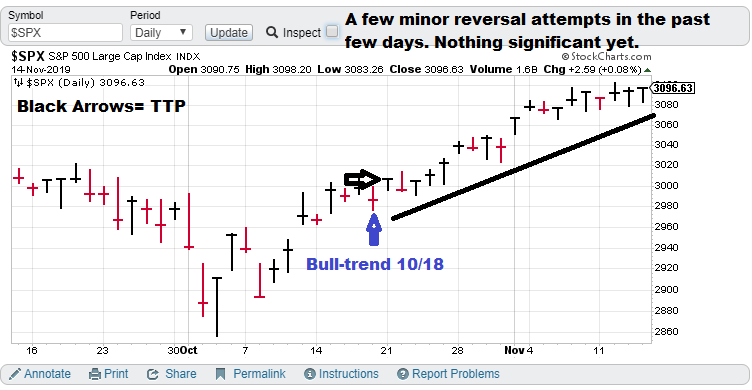
$SPX (S&P 500), Bull-trend signal (10/18/19) with TTP= 3006.72.

Current price for CTM research (signals), $15,000 per quarter for the S&P 500 “fast” nonlinear model. The faster model is more optimized for options trading.

Model notes: Todays S&P 500 close is the highest of the week so far.  So far, we have kept with the trend while avoiding being tripped out by false signals that trick bulls out of a bullish trend. Model still in-sync. Chaotic trend / nonlinear trend analysis is giving us the glimpse at the future trend.

What? Well, the impeachment is on. With a Republican controlled senate, it seems like a waste of time. I would like to share how I look at this. The Democratic Party is fractured into 2 halves: liberals (Biden) and progressives (Jr. Communist, Bernie Sanders). Progressives consider Warren a liberal, trying to pass herself off as a progressive. The liberals have received some analysis advising them they will lose 2020 no matter who runs from their current 3+1 (Buttigieg) team. For them the impeachment is a disparate “hail Mary” pass, trying to snatch victory from defeat. The progressives are actually trying to take over the Democratic Party. To them this is an attempt to remove Joe Biden through displaying Hunter Biden’s corruption (also a jab at Trump is okay for them). The market is taking a longer-term view of this and is ignoring the hearings largely.

Note: The following comments are based on using technical analysis to ‘flesh out’ our nonlinear trading signals. TTP (Theoretical Transaction Day) is defined as the closing price on the day following the signal day.

Nonlinear Trading Themes:

  • S&P 500 forecast (SPX): S&P closed at the high of the week, despite limited selling over the past several trading days, since Nov 7th.  The bears don’t seem to have the firepower to drive the market down yet. The clumsy political machinations by the Democratic Party has not provided enough angst (against the backdrop of a Republican-controlled Senate) to bring in sellers. Technical trend is still up. Nonlinear / Chaotic indicators are still bullish. We are watching.

GH Garrett – Chief Market Analyst for ConquertheMummy.com  © 2015-2019, “Nonlinear trading signals that matter in stock index and S&P 500 trading.”

11/8/19 S&P 500 drifts up, bears can’t dig in their heels yet.

2-month (approx) focus chart.

Current Market Forecast (slow model):

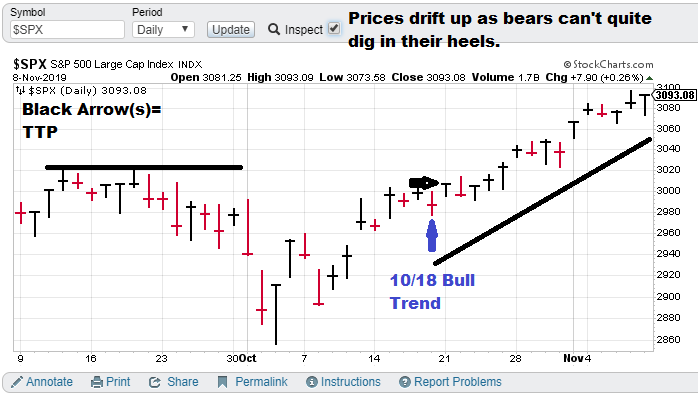
$SPX (S&P 500), Bull-trend signal (10/18/19) with TTP= 3006.72.

Current price for CTM research (signals), $15,000 per quarter for the S&P 500 “fast” nonlinear model. The faster model is more optimized for options trading.

Model notes: S&P 500 closes at the high of the week, sellers attempt a couple reversal attempts but couldn’t get it going. Model still in-sync. Chaotic trend / nonlinear trend analysis is giving us the glimpse at the future trend.

What? Have a great Veterans Day!

Note: The following comments are based on using technical analysis to ‘flesh out’ our nonlinear trading signals. TTP (Theoretical Transaction Day) is defined as the closing price on the day following the signal day.

Nonlinear Trading Themes:

  • S&P 500 forecast (SPX): Stocks have broken through mid-October highs and we don’t see a serious technical reversal yet. Technical trend is still up. Nonlinear / Chaotic indicators are still bullish.

GH Garrett – Chief Market Analyst for ConquertheMummy.com  © 2015-2019, “Nonlinear trading signals that matter in stock index and S&P 500 trading.”

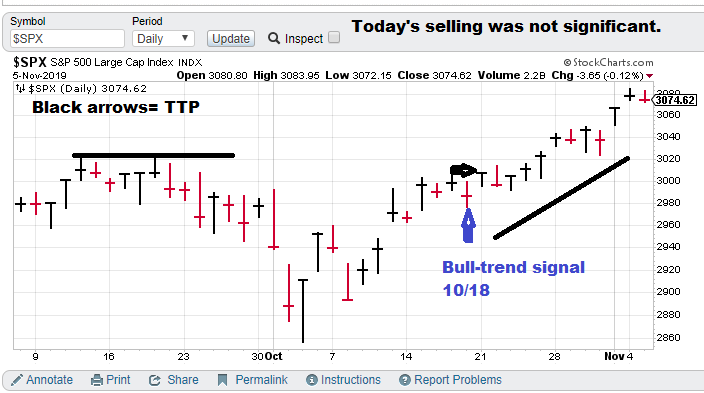
11/5/19 S&P 500 posts gains with a nonlinear nod!

11/5/19 S&P 500 posts gains with a nonlinear nod!

2-month (approx.) focus chart.

Current Market Predictions:

$SPX (S&P 500), Bull-trend signal (10/18/19) with TTP= 3006.72.

Current price for CTM research (signals), $15,000 per quarter for the S&P 500 “fast” nonlinear model. The faster model is more optimized for options trading.

Model notes: The model is in-synch with the market. Price action for the bull-trend is still upward with the most current close above the TTP. Chaotic trend / nonlinear trend analysis is giving us the edge in time-series prediction.

What? The Democratic party continues to struggle with selecting a presidential candidate. 3 top tier contenders and dark horse Pete Buttigieg (he is advancing from the lower tier).

Note: The following comments are based on using technical analysis to ‘flesh out’ our nonlinear trading signals. TTP (Theoretical Transaction Day) is defined as the closing price on the day following the signal day.

Nonlinear Trading Themes:

  • S&P 500 forecast (SPX): The bullish trend signal took some minor selling today, but the bears lacked conviction. Technical trend is still up. Nonlinear indicators are still bullish.

GH Garrett – Chief Market Analyst for ConquertheMummy.com  © 2015-2019, “Nonlinear trading signals that matter in stock index and S&P 500 trading.”

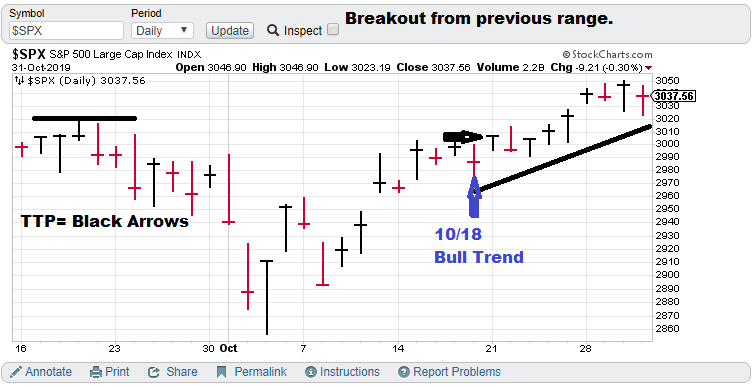
10/31/19 S&P 500 breaks out of the recent trading range!

2-month (approx.) focus chart.

Current Market Predictions:

$SPX (S&P 500), non-linear model indicates that the trading trend is now up for this index. Today (10/18/19) is the signal day. The closing price on Monday (10/21).  TTP (Theoretical Transaction Day) = 3006.72.

Current price for CTM research (signals), $15,000 per quarter for the S&P 500 “fast” nonlinear model. The faster model is more optimized for options trading.

Model notes: The model is in-synch with the market. The most recent close is higher than the close on the recent signal date and the TTP.  Chaotic trend / nonlinear trend analysis is giving us the edge in time-series prediction.

What? The death of the ISIS bigwig (Ibrahim Awad Ibrahim al-Badri) was a positive for stock trading. ISIS strength is hardly a positive for prosperity in the US.

Note: The following comments are based on using technical analysis to ‘flesh out’ our nonlinear trading signals. TTP (Theoretical Transaction Day) is defined as the closing price on the day following the signal day.

Nonlinear Trading Themes:

  • S&P 500 forecast (SPX): The trading trend made significant technical progress this week with Friday’s breakout close. Nonlinear indicators are still bullish.

GH Garrett – Chief Market Analyst for ConquertheMummy.com  © 2015-2019, “Nonlinear trading signals that matter in stock index and S&P 500 trading.”

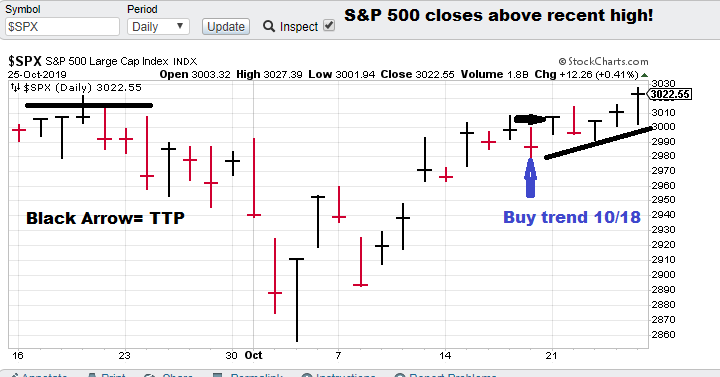
10/25/19 S&P 500 closes above recent high close!

2-month (approx.) focus chart.

Current market Predictions:

$SPX (S&P 500), non-linear model indicates that the trading trend is now up for this index. Today (10/18/19) is the signal day. The closing price on Monday (10/21).  TTP (Theoretical Transaction Day) = 3006.72.

Current price for CTM research (signals), $15,000 per quarter for the S&P 500 “fast” nonlinear model. The faster model is more optimized for options trading.

Model notes: The model is looking good. Price closed at a new recent high 5 trading days after signal date. Chaotic trend analysis is giving us the edge in time-series prediction.

What? The impeachment effort is starting to look more like the Crazy Train.  So far, it’s not holding the market back.

Note: The following comments are based on using technical analysis to ‘flesh out’ our nonlinear trading signals. TTP (Theoretical Transaction Day) is defined as the closing price on the day following the signal day.

Nonlinear Trading Themes:

  • S&P 500 Index forecast (SPX): The trading trend made significant technical progress this week with Friday’s breakout close. Nonlinear indicators are still bullish.

GH Garrett – Chief Market Analyst for ConquertheMummy.com  © 2015-2019, “Nonlinear trading signals that matter in stock index and S&P 500 index trading.”

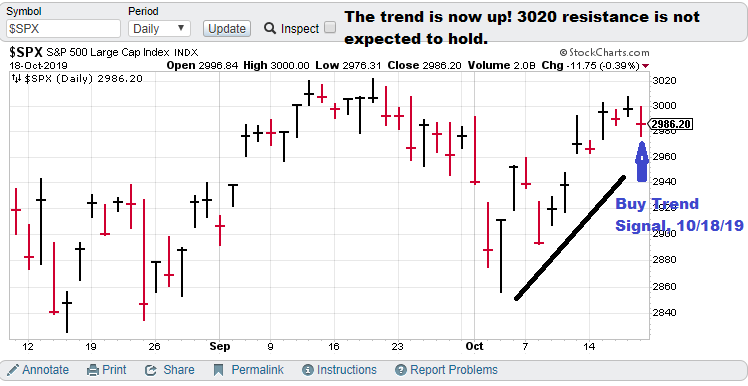
10/18/19 Changing our direction. S&P 500 is our new target! A bullish start!

2-month (approx.) focus chart.

Current market Predictions:

$SPX (S&P 500), non-linear model indicates that the trading trend is now up for this index. Today (10/18/19) is the signal day. The closing price on Monday is the TTP (Theoretical Transaction Day).

Current price for CTM research (signals), $15,000 per quarter for the S&P 500 “quick march” nonlinear model. It is a faster model more optimized for options trading.

Model notes: My data provider seemed to go AWOL on my bitcoin data for almost a week. I am taking this opportunity to optimize the nonlinear models on the far more popular S&P 500 index. The model signals are from our basic model.

What? On my last post I indicated that Ukraine impeachment initiative is a progressive plot to weaken Biden’s presidential bid, which it has done in terms of reducing fund raising and voter poll results. Warren seems to be benefitting, moving to front runner status.  However, she has another issue. Electability.

Note: The following comments are based on using technical analysis to ‘flesh out’ our nonlinear trading signals. TTP (Theoretical Transaction Day) is defined as the closing price on the day following the signal day.

Nonlinear Trading Themes:

  • S&P 500 Index forecast ($SPX): The trading trend is pointed skyward. Nonlinear indicators expect the index to break through the 3020 level.

GH Garrett – Chief Market Analyst for ConquertheMummy.com  © 2015-2019, “Nonlinear trading signals that matter in stock index and S&P 500 index trading.”