Tag Archives: Nonlinear Trading Themes

Interest Rate model goes flat (TBT)

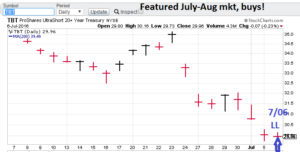
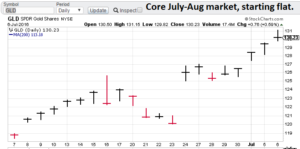
July-Aug Rotations: Core Mkt = GLD, Featured Mkt = TBT.

Signals: GLD = Flat (TSP= N/A), TBT= Flat (Exit long) 7/19 (TSP= waiting).

Model notes: The rate model issued a ‘flat’ signal (exit long). The market is generally higher than the 7/06 buy so this is probably going to prove to be a good trade, but we will have to wait for the TSP to get the final verdict. The gold model is not showing any action yet. On the plus side the GLD is very close to its monthly closing price on June 30. If there is no opportunity it is better to stay out before some adverse news event pops out of the closet to get your money!

Note: The TSP (theoretical Signal Price) metric is calculated by using the ‘close’ price of the trading day FOLLOWING the signal day.

Note: The following comments are based on using technical analysis to ‘flesh out’ our nonlinear trading signals.

Nonlinear Trading Themes:
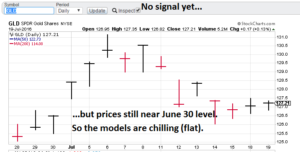
  • CTM160719gGold Trading Signals (Core). Gold is flat for the month in terms of today’s close versus the close on June 30. The models don’t see that changing soon. The model gold portfolio is flat.
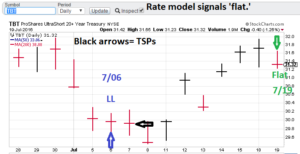
  • CTM160719bInterest Rates (Featured). The TBT (interest rates) bounced off the recent lows and moved the rate higher than the July 6 signal TSP. Today the model signaled an exit (go to flat). This plays into the general theme of anemic economic growth and the impression that the Yellen-led Fed is going to do everything NOT to act. Anyway the model interest rate portfolio is now flat.


Premium Research notes:

Observation: Don’t sit around your Monday morning meetings giving each other high-fives with a two-star fund or strategy on the books. Contact me for more info. Click the ‘Ranking’ tab to find out more. By the way, in 2016, I am only going to take on 6 clients. CTM can help and our rates are reasonable!

We are now offering asset class ranking (or alternatively sector ranking), using our trading signal technology on a longer timeframe. This is an exciting new product as portfolio construction has one glaring, missing puzzle piece: what asset classes will continue to outperform/advance for next month? Get your independent research here, put my 25+ years of model building experience to work for you!

Take a minute to peruse the US Equities tab. I posted the S&P 500 trading signals postmortem for the recent March-April time period (approx. as it took about a week to generate a signal at the beginning). Plus 134 Points. Great stuff!

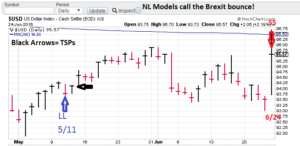
Take a minute to check out the Forex tab on our website. I am posting the recent US Dollar May-June signals. No whipsaws and playing the surprise Brexit vote just right. Great stuff!

GH Garrett – Chief Market Analyst for ConquertheMummy.com  © 2015-2016, “Nonlinear trading signals that matter in gold (and interest rate) trading.”
Interest Rates Ticking Up (TBT)

July-Aug Rotations: Core Mkt = GLD, Featured Mkt = TBT.

Signals: GLD = Flat (TSP= N/A), TBT= Long 7/06 (TSP= 29.93).

Model notes: Our first signal in the new time period is the “Long” TBT signal (July 6), and the market is ticking up, so the model does seem to be in sync with reality. The call suggests we have a near-term bottom in interest rates. The gold market is another story. July action has not been very decisive. Gold initially moved up, then fell back a bit. The GLD is near the level it trading on June 30. The Model has kept us out of a non-trending market. Sound goods to me.

Note: The TSP (theoretical Signal Price) metric is calculated by using the ‘close’ price of the trading day FOLLOWING the signal day.

Note: The following comments are based on using technical analysis to ‘flesh out’ our nonlinear trading signals.

Nonlinear Trading Themes:

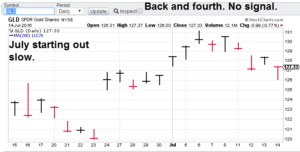
  • CTM160714gGold Trading Signals (Core). Gold is starting the month off at a slow pace. The GLD is near the trading level of June 30. We are evaluating the models looking for a signal, and a chance to enter a trade. For now, the model gold portfolio is flat.
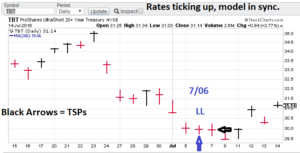
  • CTM160714bInterest Rates (Featured). Do we have a near-term bottom in place? The models are suggesting that. The TBT is bouncing off the July 8 washout lows. The model interest rate portfolio is now long the TBT.


Premium Research notes:

Observation: Don’t sit around your Monday morning meetings giving each other high-fives with a two-star fund or strategy on the books. Contact me for more info. Click the ‘Ranking’ tab to find out more. By the way, in 2016, I am only going to take on 6 clients. CTM can help and our rates are reasonable!

We are now offering asset class ranking (or alternatively sector ranking), using our trading signal technology on a longer timeframe. This is an exciting new product as portfolio construction has one glaring, missing puzzle piece: what asset classes will continue to outperform/advance for next month? Get your independent research here, put my 25+ years of model building experience to work for you!

Take a minute to peruse the US Equities tab. I posted the S&P 500 trading signals postmortem for the recent March-April time period (approx. as it took about a week to generate a signal at the beginning). Plus 134 Points. Great stuff!

Take a minute to check out the Forex tab on our website. I am posting the recent US Dollar May-June signals. No whipsaws and playing the surprise Brexit vote just right. Great stuff!

GH Garrett – Chief Market Analyst for ConquertheMummy.com  © 2015-2016, “Nonlinear trading signals that matter in gold (and interest rate) trading.”
Gold and Interest rates rotate on (GLD, TBT)

July-Aug Rotations: Core Mkt = GLD, Featured Mkt = TBT.

Signals: GLD = Flat (TSP= N/A), TBT= Long 7/06 (TSP= waiting).

Model notes: We are moving to July and August with our old standby (Gold) and interest rates (TBT). I am very excited to proceed with interest rates with our latest model revisions as this has been the most resistant to nonlinear modeling. I suspect it involves the Government intervention (Fed) however we should have better results this time.

Note: The TSP (theoretical Signal Price) metric is calculated by using the ‘close’ price of the trading day FOLLOWING the signal day.

Note: The following comments are based on using technical analysis to ‘flesh out’ our nonlinear trading signals.

Nonlinear Trading Themes:

  • CTM160705gGold Trading Signals (Core). Gold is staring off slow as far as a signal is concerned. The post-Brexit, post-July 4 holiday trading features the yellow metal climbing but at fairly high levels. The models are conflicted; thus we have a flat signal so far on this one.
  • CTM160705bInterest Rates (Featured). The post-Brexit, post-July 4 holiday trading for interest rates managed to push our models on buy. So, to be clear, we are now expecting higher interest rates going forward. The implications for this are constructive for the economy in general. The model interest rate model is now long the TBT.


Premium Research notes:

Observation: Don’t sit around your Monday morning meetings giving each other high-fives with a two-star fund or strategy on the books. Contact me for more info. Click the ‘Ranking’ tab to find out more. By the way, in 2016, I am only going to take on 6 clients. CTM can help and our rates are reasonable!

We are now offering asset class ranking (or alternatively sector ranking), using our trading signal technology on a longer timeframe. This is an exciting new product as portfolio construction has one glaring, missing puzzle piece: what asset classes will continue to outperform/advance for next month? Get your independent research here, put my 25+ years of model building experience to work for you!

Take a minute to peruse the US Equities tab. I posted the S&P 500 trading signals postmortem for the recent March-April time period (approx. as it took about a week to generate a signal at the beginning). Plus 134 Points. Great stuff!

Take a minute to check out the Forex tab on our website. I am posting the recent US Dollar May-June signals. No whipsaws and playing the surprise Brexit vote just right. Great stuff!

GH Garrett – Chief Market Analyst for ConquertheMummy.com  © 2015-2016, “Nonlinear trading signals that matter in gold (and interest rate) trading.”
Wheat and the Greenback rotate off! ($usd, ^wn16)

May-June Rotations: Core Mkt = Wheat, Featured Mkt = US Dollar.

Signals: Wheat= Long 6/24 (TSP= 447), USD= Short 6/24 (TSP= 96.70).

Model notes: We are waiving farewell to wheat and the greenback. Our results were good (3 out of 4, 2 out of 2, respectively). By using nonlinear analysis, ConquerTheMummy (CTM) was not fooled by the parade of luminaries (including Obama) predicting a “remain” Brexit vote. Cutting through the misdirection! Look for our next rotations: GLD (gold, core) and TBT (interest rates, featured), in July and August trading signals. Adventures await at the CTM website.

Note: The TSP (theoretical Signal Price) metric is calculated by using the ‘close’ price of the trading day FOLLOWING the signal day.

Note: The following comments are based on using technical analysis to ‘flesh out’ our nonlinear trading signals.

Nonlinear Trading Themes:

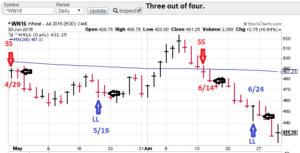
  • CTM160630wWheat Trading Signals (Core). Our winning trades percentage was good (3 of 4). I would have liked to have caught the mid-June short a little sooner and the end of month buy a little later, but CTM models had the flow of the market. What is next? If the dollar continues to drop, that should be a plus for grains. Wheat watchers need to watch the deflationary front though. If an eventual wave of deflation goes through, that will be tough for commodities in general. I hope you enjoyed the two-month wheat tour, Look for gold next!
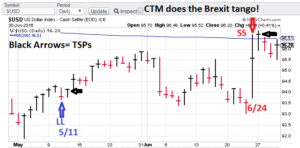
  • CTM160630uUS Dollar Signals (Featured). CTM models played the Brexit tango well, avoiding getting whipsawed in the pre-vote luminary enhanced swirl, then getting setup for a near perfect post-vote position reversal. The trading chestnut, “listening to politicians can get you killed.” The future for the dollar? The models are still short, bears have the advantage, but they need to be alert that the next major developed county to raise rates is likely to be the USA. The next featured market is going to be the TBT (interest rates) so if you follow this website over the next two months, we will help you see that issue coming, hopefully just before it happens!


Premium Research notes:

Observation: Don’t sit around your Monday morning meetings giving each other high-fives with a two-star fund or strategy on the books. CTM can help and our rates are reasonable!

We are now offering asset class ranking (or alternatively sector ranking), using our nonlinear trading signal technology on a longer timeframe. This is an exciting new product as portfolio construction often has one glaring missing puzzle piece: what asset classes will continue to outperform/advance for next month? Get your independent research here! Contact me for more info. Click the ‘Ranking’ tab to find out more. By the way, in 2016, I am only going to take on 6 clients.

Take a minute to peruse the US Equities tab. I posted the S&P 500 trading signals postmortem for the recent March-April time period (approx. as it took about a week to generate a signal at the beginning). Plus 134 Points. Great stuff!

Take a minute to check out the Forex tab on our website. I am posting the recent US Dollar May-June signals. No whipsaws and playing the surprise Brexit vote just right. Great stuff!

GH Garrett – Chief Market Analyst for ConquertheMummy.com  © 2015-2016, “Nonlinear trading signals that matter in gold (and wheat) trading.”

Brexit rocks the markets but not CTM! ($usd)

May-June Rotations: Core Mkt = Wheat, Featured Mkt = US Dollar.

Signals: Wheat= Long 6/24 (TSP= waiting), USD= Short 6/24 (TSP= waiting).

Model notes: Wow. The British choose freedom over (promised) prosperity. ConquerTheMummy (CTM) nonlinear analysis was not fooled by the parade of luminaries (including Obama) predicting a “remain” vote. Good Job. What now? Both the dollar and wheat models have reversed based on today’s movements. I believe that nonlinear analysis may well shed light on many things to come. It is a great time to be following the CTM website.

Note: The TSP (theoretical Signal Price) metric is calculated by using the ‘close’ price of the trading day FOLLOWING the signal day.

Note: The following comments are based on using technical analysis to ‘flesh out’ our nonlinear trading signals.

Nonlinear Trading Themes:

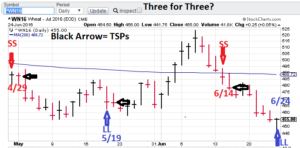
  • CTM160624wWheat Trading Signals (Core). Brexit was negative on wheat, which was okay as we were short. The grain picked up support near the 455 level (which we have talked about before). The nonlinear models indicate we are now in a buy mode. The model wheat portfolio is now long. Note: Our core market for July-August will be gold.
  • CTM160624uUS Dollar Signals (Featured). The greenback (post Brexit) pop pushed our long position back into the money and the nonlinear models then reversed to short. The model dollar model is now bearish. Please note: The next featured market for July-August is going to be either US Bonds or interest rates.


Premium Research notes:

Observation: on one of my recent sales phone calls to an analyst, I was told it was very hard to get independent research in the firm. it amazed me as that fund family featured a 2-star fund (Morningstar, 3yr window) in its offering. Using independent research helps to combat institutional bias. CTM rates on our asset class ranking are very reasonable as well. If you are struggling with returns, please contact me, let’s see if I can help. Don’t sit around your Monday meetings giving each other high-fives with a two-star fund on the books.

We are now offering asset class ranking (or alternatively sector ranking), using our trading signal technology on a longer timeframe. This is an exciting new product as portfolio construction has one glaring missing puzzle piece: what asset classes will continue to advance for next month? We can help with that. Get your independent research here! By the way, in 2016, I am only going to take on 6 clients. Contact me for more info. Click the ‘Ranking’ tab to find out more.

Take a minute to peruse the US Equities tab. I posted the S&P 500 trading signals postmortem for the recent March-April time period (approx. as it took about a week to generate a signal at the beginning). Plus 134 Points. Great stuff!

GH Garrett – Chief Market Analyst for ConquertheMummy.com  © 2015-2016, “Nonlinear trading signals that matter in gold (and wheat) trading.”

Dollar struggles, but support is near. ($usd)

May-June Rotations: Core Mkt = Wheat, Featured Mkt = US Dollar

Signals: Wheat= Short 6/14 (TSP 478.25), USD= Long 5/11 (TSP 94.13)


Model notes: The latter half of June has been rough on the models. Wheat is (so far) 3 for 3 but I lost a fair amount of ground in the recent selloff. But the models do seem in sync. The dollar model signals have suffered more as we only have one trade, most of the time has been spent in the money but we are now dipping our toe in the red ink of loss-land. But we could have a bounce. Is the greenback model in sync? This one may go down to the line (June 30).

Note: The TSP (theoretical Signal Price) metric is calculated by using the ‘close’ price of the trading day FOLLOWING the signal day.

Note: The following comments are based on using technical analysis to ‘flesh out’ our nonlinear trading signals.

Nonlinear Trading Themes:

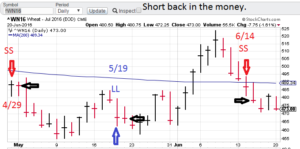
  • CTM160620wWheat Trading Signals (Core). Wheat has moved dropped, real support is near the 455 level. The brief pop on June 17 did not get any follow-through. Wheat model is negative and the bears seem to have the edge.
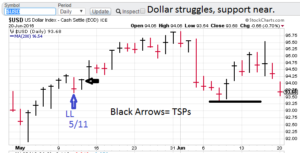
  • CTM160620uUS Dollar Signals (Featured). The greenback is struggling. Each day seems to push it a little lower (we recently anyway) but the models are positive and we have real trading support at the 93.50 level. So the bet is bullish. The model dollar portfolio is positive.


Premium Research notes:

We are now offering asset class ranking (or alternatively sector ranking), using our trading signal technology on a longer timeframe. This is an exciting new product as portfolio construction has one glaring missing puzzle piece: what asset classes will continue to advance for next month? We can help with that. Get your independent research here! By the way, in 2016, I am only going to take on 6 clients. Contact me for more info. Click the ‘Ranking’ tab to find out more.

Take a minute to peruse the US Equities tab. I posted the S&P 500 trading signals postmortem for the recent March-April time period (approx. as it took about a week to generate a signal at the beginning). Plus 134 Points. Great stuff!

GH Garrett – Chief Market Analyst for ConquertheMummy.com  © 2015-2016, “Nonlinear trading signals that matter in gold (and wheat)  trading.”

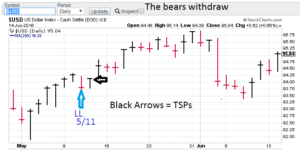
Dollar getting some lift, bears withdraw ($usd)

May-June Rotations: Core Mkt = Wheat, Featured Mkt = US Dollar

Signals: Wheat= Short 6/14 (TSP= waiting), USD= Long 5/11 (TSP 94.13)

Model notes: The bears riding the early June selloff on the dollar seem to be pulling back as the greenback gets some lift. I would have liked the model to have gotten us out before the drop and then back in, but the one-day drop was tough to catch. The dollar model seems back in sync. On the wheat side, the recent selling seems to be stronger than warranted for a true uptrend.  We will have to see how this runs the course. Anyway, we have the sell from the model on wheat.

Note: The TSP (theoretical Signal Price) metric is calculated by using the ‘close’ price of the trading day FOLLOWING the signal day.

Note: The following comments are based on using technical analysis to ‘flesh out’ our nonlinear trading signals.

Nonlinear Trading Themes:

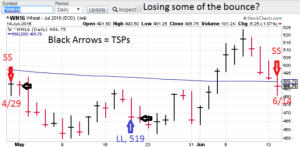
  • CTM160614wWheat Trading Signals (Core). Earlier I commented on wheat punching north of its previous trading range. The models now indicate this latest move is just an extension of the trading range, and that a drop back to the 455 area is likely. The wheat model is now short. We will have to see what the TSP (tomorrow’s close).
  • CTM160614uUS Dollar Signals (Featured). The 6/3 considerable drop picked up limited follow-through selling. The models are now signaling higher prices and the greenback seems to be headed (again) to the 96 level. The trade is still positive (current close to TSP). The model dollar portfolio is long.


Premium Research notes:

We are now offering asset class ranking (or alternatively sector ranking), using our trading signal technology on a longer timeframe. This is an exciting new product as portfolio construction has one glaring missing puzzle piece: what asset classes will continue to advance for next month? We can help with that. Get your independent research here! By the way, in 2016, I am only going to take on 6 clients. Contact me for more info. Click the ‘Ranking’ tab to find out more.

Take a minute to peruse the US Equities tab. I posted the S&P 500 trading signals postmortem for the recent March-April time period (approx. as it took about a week to generate a signal at the beginning). Plus 134 Points. Great stuff!

GH Garrett – Chief market analyst for ConquertheMummy.com  © 2015-2016, “Nonlinear trading signals that matter in gold (and wheat)  trading.”

Dollar Reverses Back to the upside! ($usd)

May-June Rotations: Core Mkt = Wheat, Featured Mkt = US Dollar

Signals: Wheat= Long 5/19 (TSP 467.25), USD= Long 5/11 (TSP 94.13)

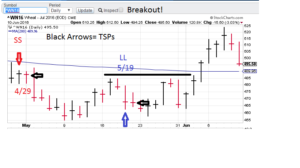
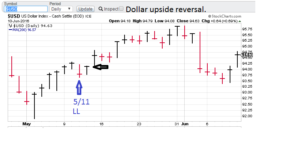
Model notes: On the dollar, we were not able to sell near the 96 highs a couple of weeks ago, but a second chance is in the offing with this week’s reversal. The models are still positive and the possibility of a retest or the approx. 96 level is definitely on the table. Also we are now back in-the-money! On the wheat side, the grain has punched out through the recent trading range (455-485). So the models have the trend as ‘up’ and this is what the grain market has given us. Both models are still in sync with their respective markets.

Note: The TSP (theoretical Signal Price) metric is calculated by using the ‘close’ price of the trading day FOLLOWING the signal day.

Note: The following comments are based on using technical analysis to ‘flesh out’ our nonlinear trading signals.

Nonlinear Trading Themes:

  • CTM160610wWheat Trading Signals (Core). Wheat punched out of the 455-485 trading range to the upside (which was good for the current buy signal). Friday’s reversal, while hefty, stopped short of dropping back in the previous trading range. It is not uncommon for breakouts to feature a brief retest of the top of the previous range. Models are still a go, and the model wheat portfolio is still long.
  • CTM160610dUS Dollar Signals (Featured). We missed the opportunity to sell out near the previous 96 highs but the greenback bulls were able to put together a rally by the end of the week. The Friday price is north of the current signal TSP (good) and the next is right at 96 (good again). Recently the models reiterated their support for the greenback. The model dollar portfolio is long.


Premium Research notes:

We are now offering asset class ranking (or alternatively sector ranking), using our trading signal technology on a longer timeframe. This is an exciting new product as portfolio construction has one glaring missing puzzle piece: what asset classes will continue to advance for next month? We can help with that. Get your independent research here! By the way, in 2016, I am only going to take on 6 clients. Contact me for more info. Click the ‘Ranking’ tab to find out more.

Take a minute to peruse the US Equities tab. I posted the S&P 500 trading signals postmortem for the recent March-April time period (approx. as it took about a week to generate a signal at the beginning). Plus 134 Points. Great stuff!

GH Garrett – Chief market analyst for ConquertheMummy.com  © 2015-2016, “Nonlinear trading signals that matter in gold (and wheat)  trading.”

What!?! (Dollar crash) ($USD)

May Rotations: Core= wheat, Featured= US dollar

Signals: wheat Long 5/19 (TSP=467.25), US dollar buy 5/11 (TSP= 94.13)

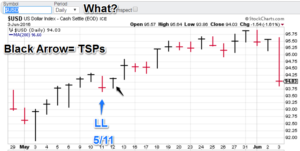
Model Notes: The dollar drop on Friday caught seemingly everyone by surprise (us too) but CTM had one advantage, we entered much lower (TSP 94.13) so the drop basically put us very near our entry levels.  Our models are still positive on the green back, so we expect a bounce next week. The wheat model is doing well and the recent buy signal was enhanced by the Friday currency dislocation. The grain market has a rangebound feel to it, but the models are not signaling a sell yet.

Note: TSP is calculated by using the closing price of the trading day after the signal day. It is more realistic for trading calculations/evaluations.

Nonlinear Trading Themes:

  • CTM160603wWheat Trading Signals (May core market) The buy signal is actually getting better on the back of the currency dislocation on Friday. The 455 support level held and prices are going higher. The models are not signaling a halt yet, but I have some indications of a possible trend change in the new week. Wheat trackers, stay with us! The CTM models are still bullish.
  • CTM160603uUS Dollar Trading Signals (May feature): The greenback took a nose dive on Friday but due to a pretty good entry (TSP 467.25) the position is near breakeven. For now the models are indication limited downside and we are staying positive. The currency market is trying to work through the change of perception that the US economy is not as strong as earlier thought (employment is weaker).

Premium Research notes:

We are now offering asset class ranking (or alternatively sector ranking), using our trading signal technology on a longer timeframe. This is an exciting new product as portfolio construction has one glaring missing puzzle piece: what asset classes will continue to advance for next month? We can help with that. Get your independent research here! By the way, in 2016, I am only going to take on 6 clients. Contact me for more info. Click the “Ranking” tab to find out more.

Take a minute to peruse the US Equities tab. I posted the S&P 500 trading signals postmortem for the recent March-April time period (approx. as it took about a week to generate a signal at the beginning). Plus 134 Points. Great stuff!

GH Garrett – Chief market analyst for ConquertheMummy.com  © 2015-2016, “Nonlinear signals that matter in gold (and wheat)  trading.” 

US Dollar still climbing! ($USD)

May Rotations: Core= wheat, Featured= US dollar

Signals: wheat Long 5/19 (TSP=467.25), US dollar buy 5/11 (TSP= 94.13)

Model Notes: The buy on wheat came in at 467.25 (TSP), near todays’ close and above the 455 support area. A pretty good start. The US dollar is still moving up, leaving our buy signal behind (in a profitable way!). The models seem in sync with their respective markets.

Note: TSP is calculated by using the closing price of the trading day after the signal day. It is more realistic for trading calculations/evaluations.

Nonlinear Trading Themes:

  • CTM160524wWheat Trading Signals (May core market) The buy signal is in pretty good shape from a technical read standpoint. The market is holding above near-term support (455) and the downside momentum is waning. We are looking for reversal to the upside.
  • CTM160524uUS Dollar Trading Signals (May feature): The greenback is still drifting up. It appears the 95 resistance level has been pierced. The buzz about rate hike in June is not going to embolden dollar bears. The dollar model is positive.

Premium Research notes:

We are now offering asset class ranking (or alternatively sector ranking), using our trading signal technology on a longer timeframe. This is an exciting new product as portfolio construction has one glaring missing puzzle piece: what asset classes will continue to advance for next month? We can help with that. Get your independent research here! Click the “Ranking” tab to find out more.

Take a minute to peruse the US Equities tab. I posted the S&P 500 trading signals postmortem for the recent March-April time period (approx. as it took about a week to generate a signal at the beginning). Plus 134 Points. Great stuff!

GH Garrett – Chief market analyst for ConquertheMummy.com  © 2015-2016, “Nonlinear signals that matter in gold (and wheat)  trading.”