May Rotations: Core= wheat, Featured= US dollar
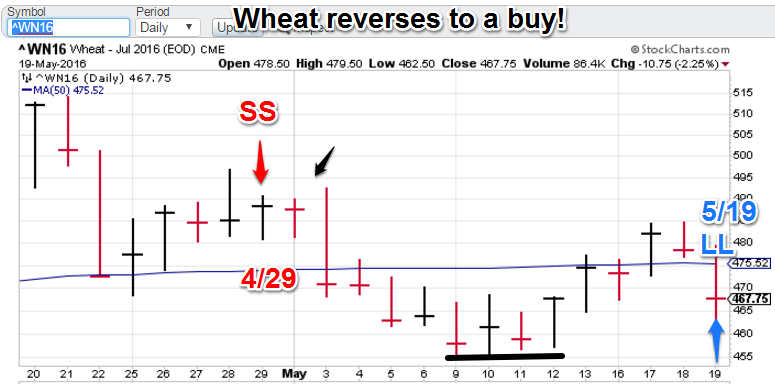
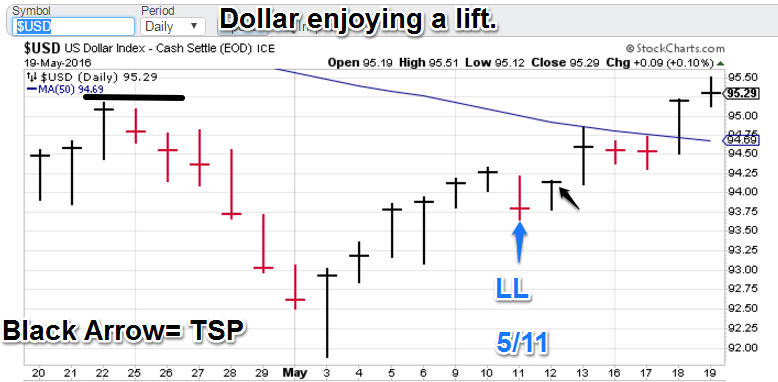
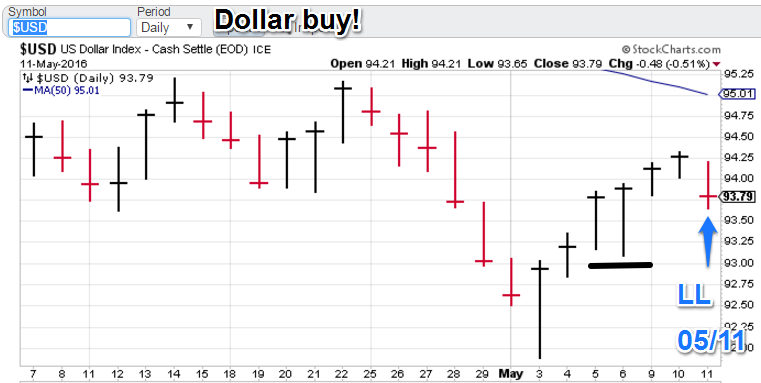
Signals: wheat Long 5/19 (TSP=467.25), US dollar buy 5/11 (TSP= 94.13)
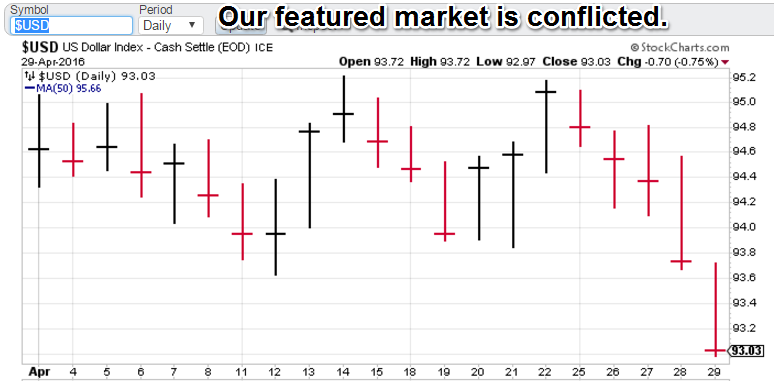
Model Notes: The dollar drop on Friday caught seemingly everyone by surprise (us too) but CTM had one advantage, we entered much lower (TSP 94.13) so the drop basically put us very near our entry levels. Our models are still positive on the green back, so we expect a bounce next week. The wheat model is doing well and the recent buy signal was enhanced by the Friday currency dislocation. The grain market has a rangebound feel to it, but the models are not signaling a sell yet.
Note: TSP is calculated by using the closing price of the trading day after the signal day. It is more realistic for trading calculations/evaluations.
Nonlinear Trading Themes:
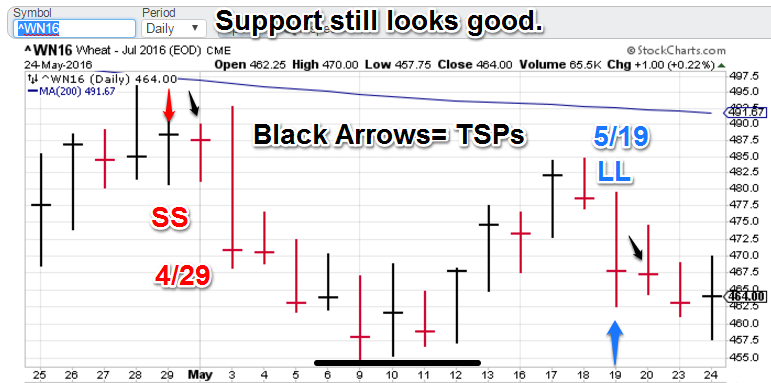
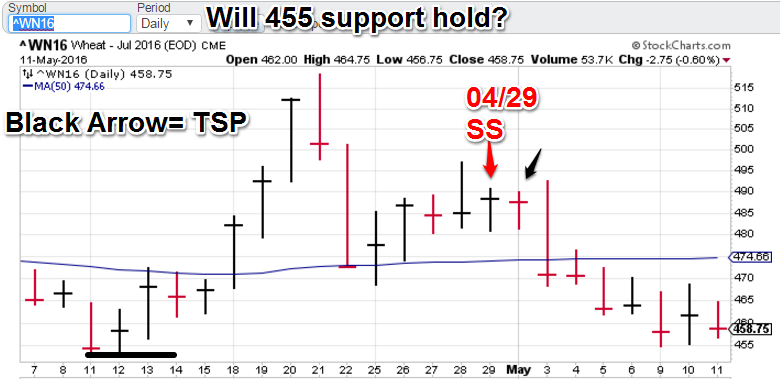
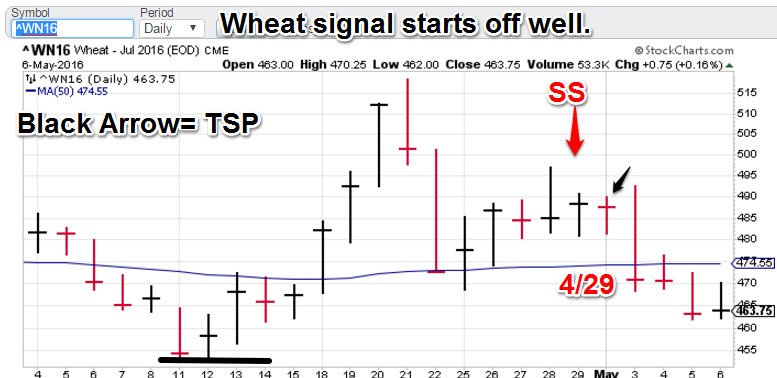
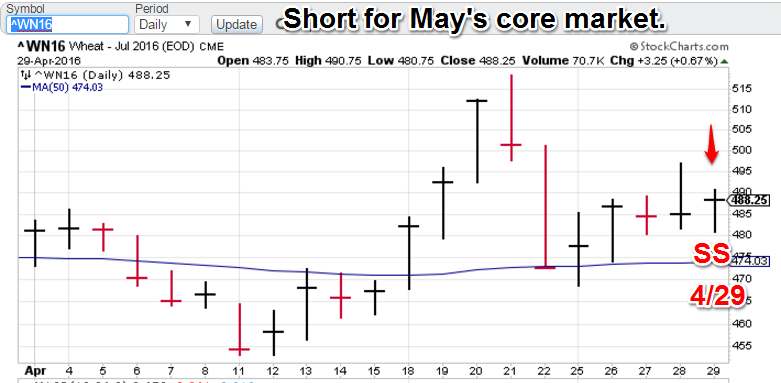
 Wheat Trading Signals (May core market) The buy signal is actually getting better on the back of the currency dislocation on Friday. The 455 support level held and prices are going higher. The models are not signaling a halt yet, but I have some indications of a possible trend change in the new week. Wheat trackers, stay with us! The CTM models are still bullish.
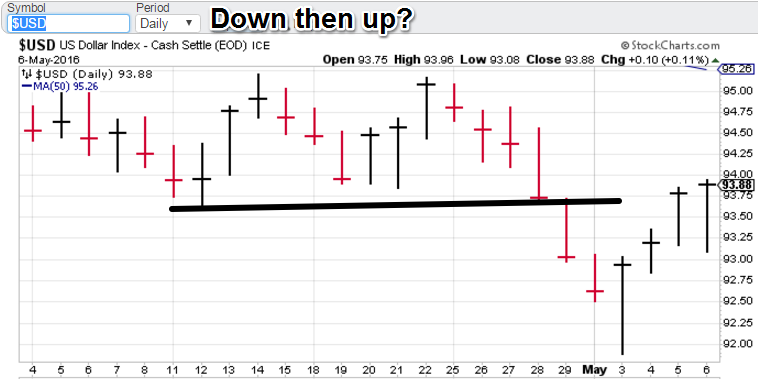
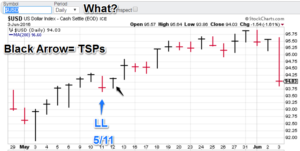 US Dollar Trading Signals (May feature): The greenback took a nose dive on Friday but due to a pretty good entry (TSP 467.25) the position is near breakeven. For now the models are indication limited downside and we are staying positive. The currency market is trying to work through the change of perception that the US economy is not as strong as earlier thought (employment is weaker).


Premium Research notes:
We are now offering asset class ranking (or alternatively sector ranking), using our trading signal technology on a longer timeframe. This is an exciting new product as portfolio construction has one glaring missing puzzle piece: what asset classes will continue to advance for next month? We can help with that. Get your independent research here! By the way, in 2016, I am only going to take on 6 clients. Contact me for more info. Click the “Ranking” tab to find out more.
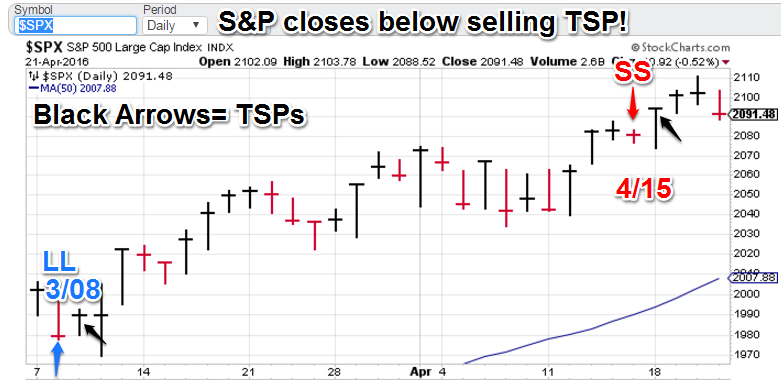
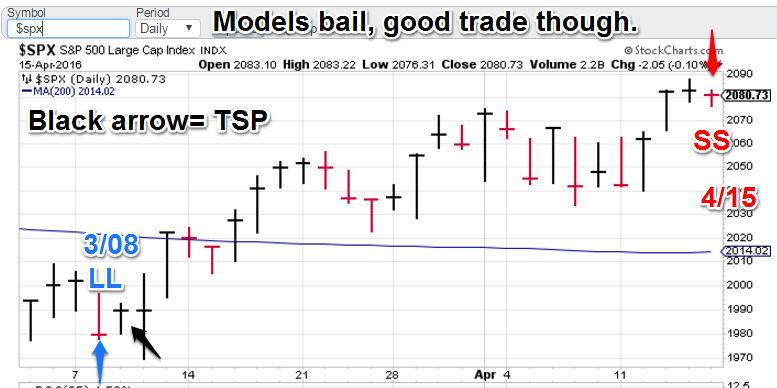
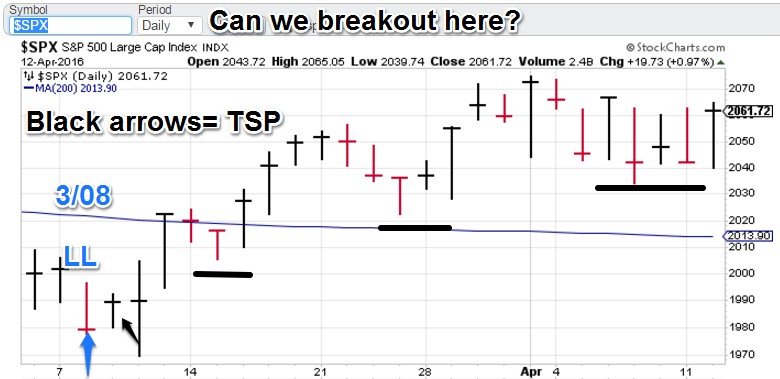
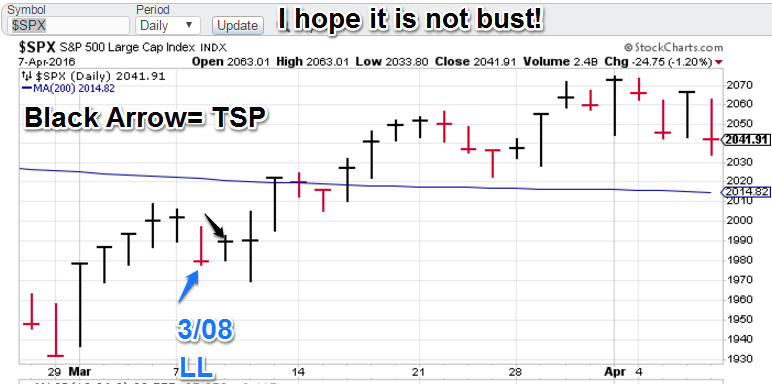
Take a minute to peruse the US Equities tab. I posted the S&P 500 trading signals postmortem for the recent March-April time period (approx. as it took about a week to generate a signal at the beginning). Plus 134 Points. Great stuff!
GH Garrett – Chief market analyst for ConquertheMummy.com © 2015-2016, “Nonlinear signals that matter in gold (and wheat) trading.”