Tag Archives: S&P trading signals

Stocks stall ($spx)

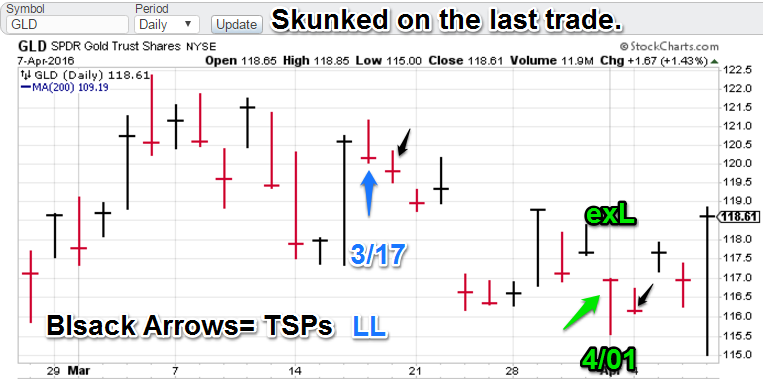
Model Notes: The stock model seems to be still in sync with the underlying market. We are well north of the entry TSP, and while we had a volatile week, we have not seen anything like a classic reversal. We had less luck on the last gold call. Our entry was followed by selling. Today’s moon-shot like rally (after our exit) was the cherry on the stink pot. Oh well, nobody said it would be easy.

March Rotations: Core Gold, Featured: S&P 500 (I am now keeping the March markets for April).

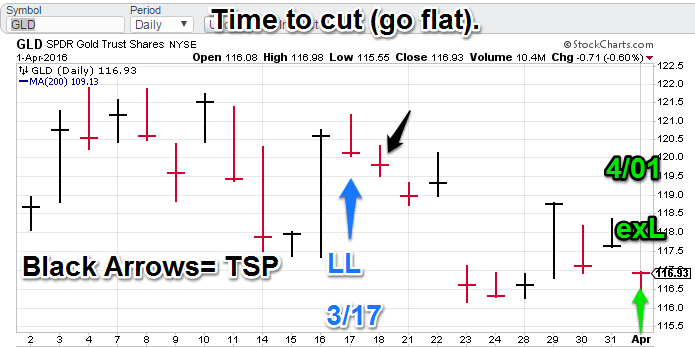
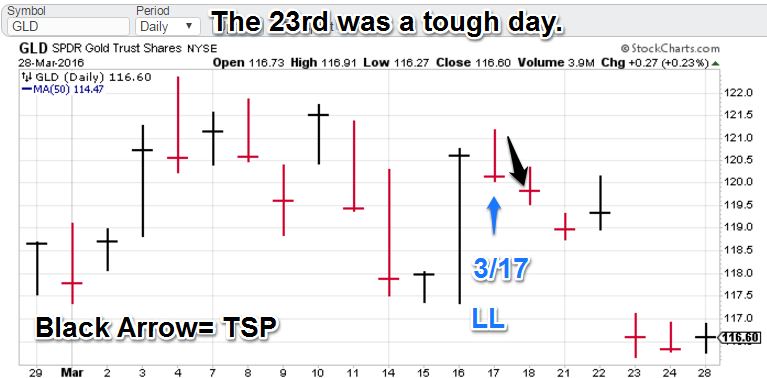
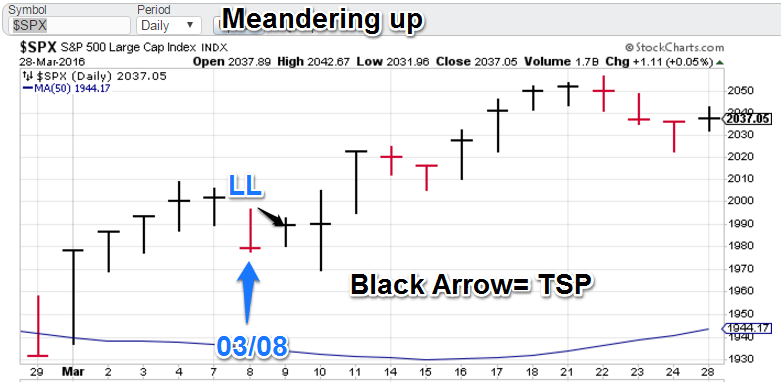
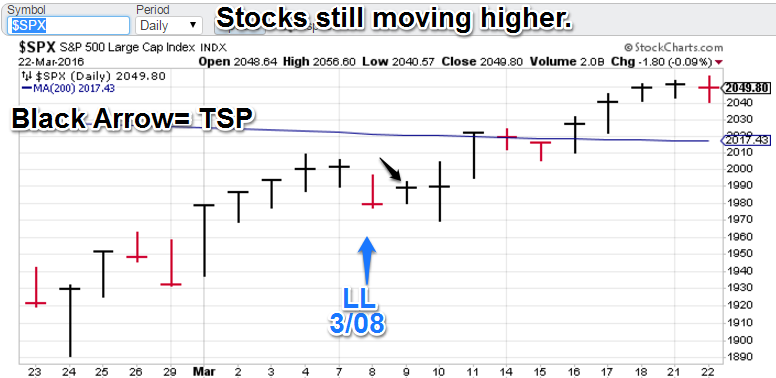
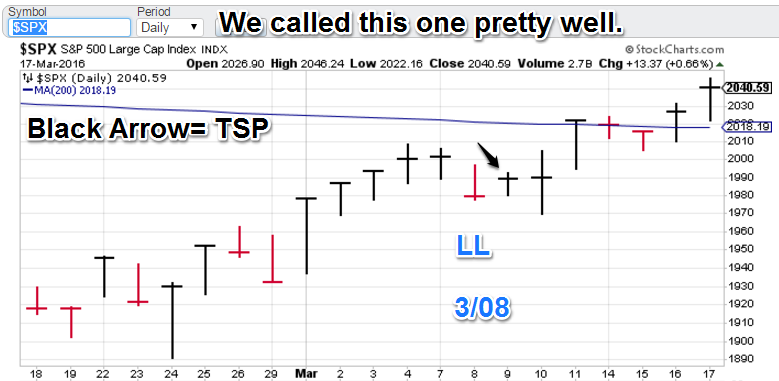
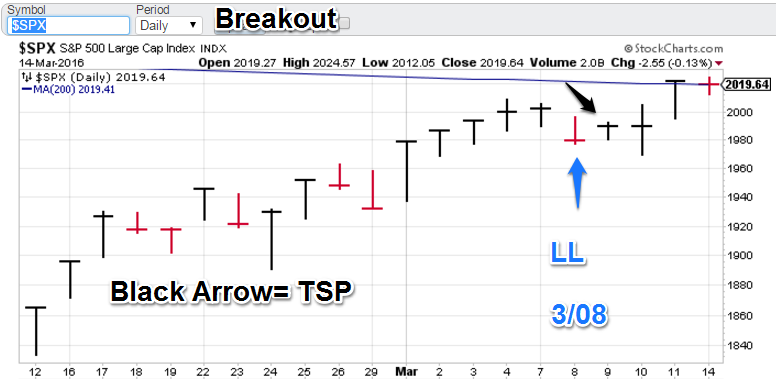
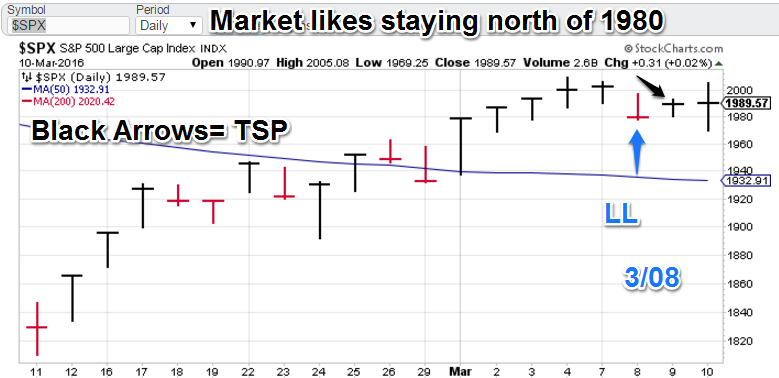
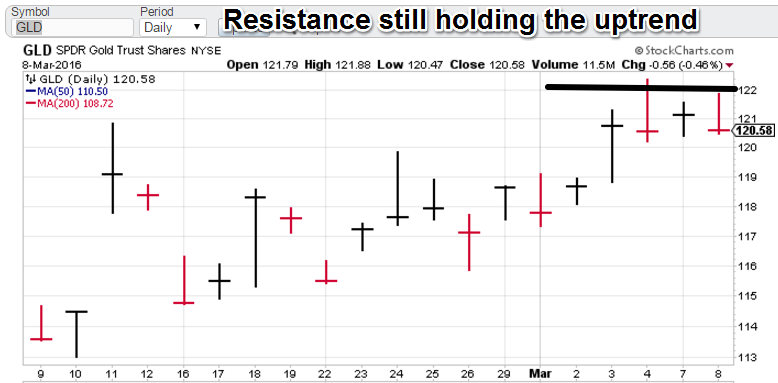
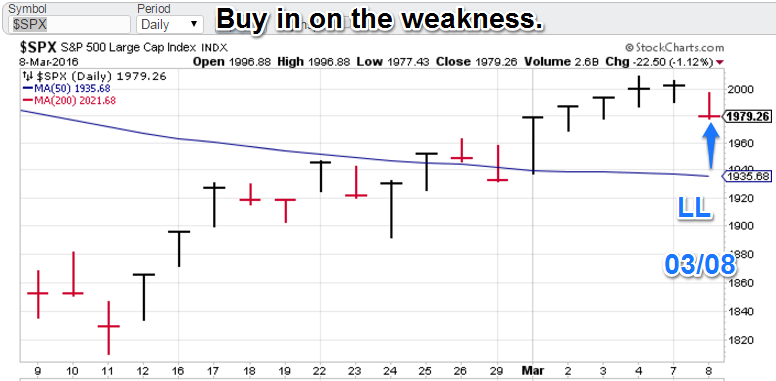
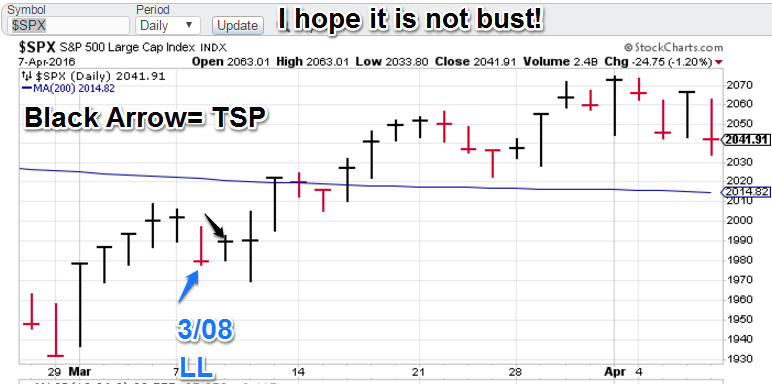
Model Portfolio Signals: GLD flat on 4/1 (TSP=116.15), S&P 500 buy on 3/08 (TSP= 1989.26)

Note: TSP is calculated by using the closing price of the trading day after the signal day. It is more realistic for trading calculations/evaluations.

Nonlinear Trading Themes:

  • CTM160407g
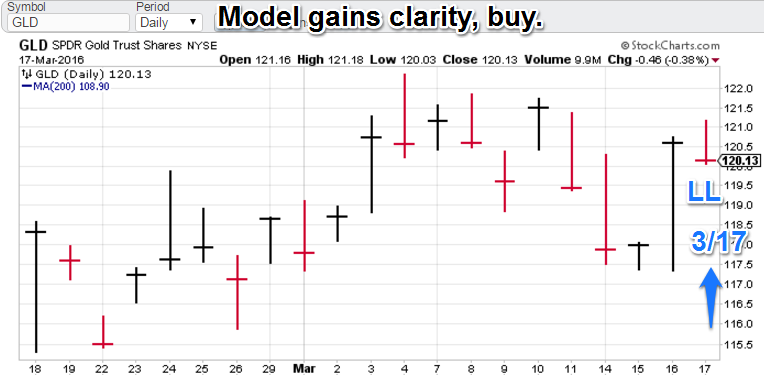
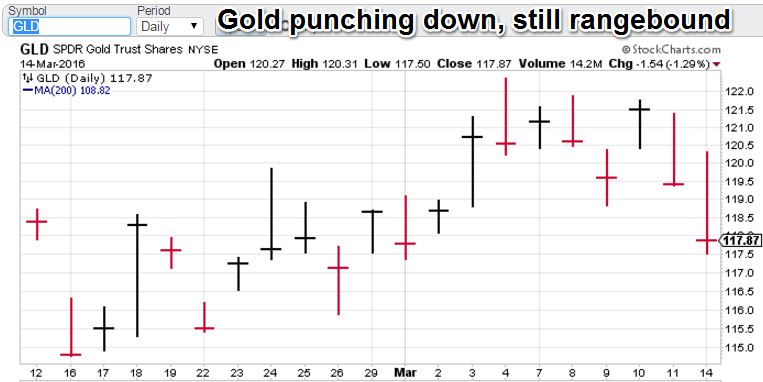
Gold (Mar. and Apr. core market) This market had a moon-shot today, closing not terribly far from our original entry. Sheesh! Recent trading is not revealing much of a trend and the models agree. Flat is the rule of the day.
  • CTM160407s
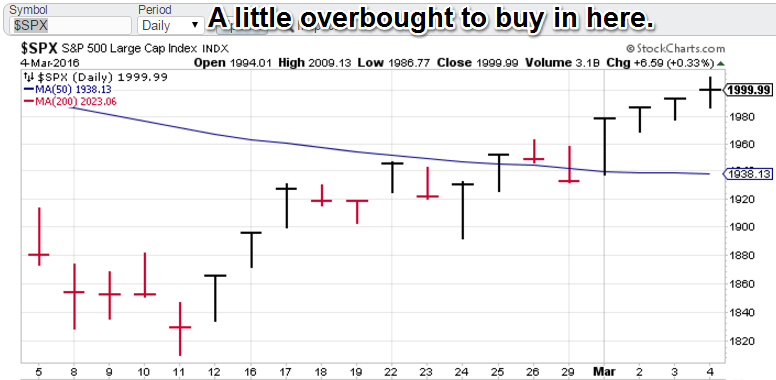
S&P 500 (Mar. and Apr. feature): The S&P 500 has received some selling this week, but it looks like more of a pause and less like a reversal. Last post I said 2100 or bust. I hope it is 2100.  The stock model stays bullish.

Premium offers:

  • I am now offering a ranking product for institutional clients engaged in asset allocation. I will be using the trading signal technology with a longer time frame to aid in portfolio construction for money managers. I have introductory rates (as low as $5,000 a quarter). Click the ‘ranking’ tab to see more. I have a limited number of slots to fill. I can fill the need for independent research.
  • Remember: Non-linear trading analysis is non-apparent and therefore like “insider knowledge” for standard technical analysis. Be the first to get a “head-up” for coming moves.
  • The post-mortems for the recent US dollar and the VIX featured markets have been posted. To view it select the “Forex” or “US Equity” tabs (respectively) on ConquerTheMummy.com.

GH Garrett – Veteran Market Watcher for ConquertheMummy.com  © 2015-2016, “Nonlinear signals that matter in gold (and wheat)  trading.” Get your independent research here!

Gold model heads to the sidelines. (GLD)

Model Notes: The gold model kicked us out of the losing trade. Friday’s action had positive aspects (settling well off the session lows) but against a backdrop of sellers pressing the support level and down-trending technicals, getting out is probably the right thing to do. Let’s see what kind of TSP we get. Stock readings are still bullish. It’s 2100 or bust. I am introducing an exciting new product to the institutional market: Asset class ranking!  Check the tab. We will be using the trading technology on a longer timeframe to help portfolio managers out-perform. This is economical and smart.

March Rotations: Core Gold, Featured: S&P 500 (I am now keeping the same markets for April).

Model Portfolio Signals: GLD flat on 4/1 (TSP=waiting), S&P 500 buy on 3/08 (TSP= 1989.26)

Note: TSP is calculated by using the closing price of the trading day after the signal day. It is more realistic for trading calculations/evaluations.

Nonlinear Trading Themes:

  • CTM160401gGold (Mar. and Apr. core market) Sellers are pressing the 117 support level (GLD basis) and short term action is displaying down trending characteristics (lower lows and lower highs). The models want none of it. The gold model is signaling flat. We have to see what we get out at with Monday’s close (the TSP value).
  • CTM160401sS&P 500 (Mar. and Apr. feature): The S&P 500 closed at the highest close of the week. The siren song to 2100 seems the favorite bet. The models agree. The stock model stays bullish.

Premium offers:

  • I am now offering a ranking product for institutional clients engaged in asset allocation. I will be using the trading signal technology with a longer time frame to aid in portfolio construction for money managers. I have introductory rates (as low as $5,000 a quarter). Click the ‘ranking’ tab to see more. I have a limited number of slots to fill.
  • I am now offering reasonable rates to institutional clients to get access to our mathematically inspired signals. Click on the ‘Fees’ tab for more info. I have a limited number of slots to fill.
  • Remember: Non-linear trading analysis is non-apparent and therefore like “insider knowledge” for standard technical analysis. Be the first to get a “head-up” for coming moves.
  • The post-mortems for the recent US dollar and the VIX featured markets have been posted. To view it select the “Forex” or “US Equity” tabs (respectively) on ConquerTheMummy.com.

GH Garrett – Veteran Market Watcher for ConquertheMummy.com  © 2015-2016, “Nonlinear signals that matter in gold (and wheat)  trading.”

A Tale of two signals. ($SPX, GLD)

Model Notes: The stock model identified and uptrend and took advantage of the upcoming pulse. This proved to be good. The gold mode also registered a buy ( little later). However the yellow metal did not do as well in the post-Brussel’s terror attack environment. The Wednesday downdraft put us out of the money on the trade but there was limited follow-through on the selling afterwards. This is a very interesting situation. To pursue it further, I am going to keep the markets the same for April.

March Rotations: Core Gold, Featured: S&P 500 (I am now keeping the same markets for April).

Model Portfolio Signals: GLD buy 3/17 (TSP=119.80), S&P 500 buy on 3/08 (TSP= 1989.26)

Note: TSP is calculated by using the closing price of the trading day after the signal day. It is more realistic for trading calculations/evaluations.

Nonlinear Trading Themes:

  • CTM160328gGold (Mar. core market) The market dumped Wednesday of last week, but follow-through selling did not appear. This is a situation seen in trading leading to the question “now what?” I am looking to the models for additional guidance.
  • CTM160328sS&P 500 (Mar. feature): The S&P 500 has had a nice bounce from the lows of the last two months (1800). Now we are closing in on recent highs (2100). Can we break through and go higher. Right now, that looks to be in the cards. Note: Non linear trading theme comments are based on interpretations of non-linear trading models, combined with chart price action (technical analysis).

Premium offers:

  • I am now offering reasonable rates to institutional clients. Click on the ‘Fees’ tab for more info. I have a limited number of slots to fill.
  • With deflationary forces becoming more dominant, top level, successful, investment strategies are going to become more reliant on ‘activity’ (trading). Check out ConquerTheMummy.com for trading signals that help!
  • Remember: Nonlinear trading analysis is “insider knowledge” (non-apparent) for standard technical analysis.
  • The post-mortems for the recent US dollar and the VIX featured markets have been posted. To view it select the “Forex” or “US Equity” tabs (respectively) on ConquerTheMummy.com.
  • I am accepting introductory offers for a slower moving asset allocation/sector rotation product using the ConquerTheMummy technology. Contact me for the details.

GH Garrett – Veteran Market Watcher for ConquertheMummy.com  © 2015-2016, “Nonlinear signals that matter in gold (and wheat)  trading.”

Stocks steady, Gold has a reversal day. ($SPX, GLD)

Model Notes: The stock model continues to track the market well. Big cap stocks seem to be trending up now. The gold model bought the dip with a theoretical signal price (TSP) of 119.80 (GLD basis). We bought just before the Brussels terrorist attack. Can a non-linear system sometimes predict a market dislocation like this? After the 911 attacks (I was in the industry then) I would have to say such attacks can be foreshadowed by buying or selling by market participants who are in the “loop” (I.E. in on it). The event would seem to be a deterrent to aggressive selling of the yellow metal.

March Rotations: Core Gold, Featured: S&P 500.

Model Portfolio Signals: GLD buy 3/17 (TSP=119.80), S&P 500 buy on 3/08 (TSP= 1989.26)

Note: TSP is calculated by using the closing price of the trading day after the signal day. It is more realistic for trading calculations/evaluations.

Nonlinear Trading Themes:

  • CTM160322gGold (Mar. core market) The last several weeks of gold trading have featured some pretty hefty down days, but the sellers have not moved the market lower in March than February. There is some strength here. The models are positive.
  • CTM160322sS&P 500 (Mar. feature): The S&P 500 is now trending up. Today’s terror attacks have not generated enough selling for a reversal yet. US equities may gain a sort of “safe haven” status for money. The stock model is still positive.

Note: Non linear trading theme comments are based on interpretations of non-linear trading models, combined with chart price action (technical analysis).

Premium offers:

  • I am now offering reasonable rates to institutional clients. Click on the ‘Fees’ tab for more info. I have a limited number of slots to fill.
  • With deflationary forces becoming more dominant, top level, successful, investment strategies are going to become more reliant on ‘activity’ (trading). Check out ConquerTheMummy.com for trading signals that help!
  • Remember: Nonlinear trading analysis is “insider knowledge” (non-apparent) for standard technical analysis.
  • The post-mortems for the recent US dollar and the VIX featured markets have been posted. To view it select the “Forex” or “US Equity” tabs (respectively) on ConquerTheMummy.com.

GH Garrett – Veteran Market Watcher for ConquertheMummy.com  © 2015-2016, “Nonlinear signals that matter in gold (and wheat)  trading.”

Gold model gains clarity, buys! (GLD)

Model Notes: Our gold model was not as eager to enter a trade as the stock model. Well, no more. The yellow metal portfolio is now on a buy with the TSP to follow soon. Gold has featured several 1-2 day high volatility moves with limited follow through. We are expecting more upside directionality. The SPX model call looks better and better. So far, so good.

March Rotations: Core Gold, Featured: S&P 500.

Model Portfolio Signals: GLD buy 3/17 (TSP=waiting), S&P 500 buy on 3/08 (TSP= 1989.26)

Note: TSP is calculated by using the closing price of the trading day after the signal day. It is more realistic for trading calculations/evaluations.

Nonlinear Trading Themes:

  • CTM160317gGold (Mar. core market) recent gold trading featured a market wildly punching without a lot of sustained directionality. We now think the bears have the losing hand and expect more positive price action. We look for a breakout above the local resistance of 122 (GLD basis). Gold model is now on a buy.
  • CTM160317sS&P 500 (Mar. feature): The S&P 500 continues to climb, supporting our bullish call. The stock model is still positive.

Note: Non linear trading theme comments are based on interpretations of non-linear trading models, combined with chart price action (technical analysis).

Premium offers:

  • I am now offering reasonable rates to institutional clients. Click on the ‘Fees’ tab for more info. I have a limited number of slots to fill.
  • With deflationary forces becoming more dominant, top level, successful, investment strategies are going to become more reliant on ‘activity’ (trading). Check out ConquerTheMummy.com for trading signals that help!
  • Remember: Nonlinear trading analysis is “insider knowledge” (non-apparent) for standard technical analysis.
  • The post-mortems for the recent US dollar and the VIX featured markets have been posted. To view it select the “Forex” or “US Equity” tabs (respectively) on ConquerTheMummy.com.

GH Garrett – Veteran Market Watcher for ConquertheMummy.com  © 2015-2016, “Nonlinear signals that matter in gold (and wheat)  trading.”

Breakout (SPX)

Model Notes: Last week nonlinear analysis indicated a breakout ahead. Friday it happened. So the model is in sync. Gold is punching lower but the current nonlinear readings still have the yellow metal in a trading range. Missing a few vigorous down days is certainly better than if the Mummy was long it. The yellow metal is still a wait and see situation.

March Rotations: Core Gold, Featured: S&P 500.

Model Portfolio Signals: GLD flat, S&P 500 buy on 3/08 (TSP= 1989.26)

Note: TSP is calculated by using the closing price of the trading day after the signal day. It is more realistic for trading calculations/evaluations.

Nonlinear Trading Themes:

  • CTM160314gGold (Mar. core market) It looks like the previous call that the 122 (GLD basis) resistance level would hold is becoming reality. But the 115 support level could hold as well. I am waiting for more clarity on this. GLD is flat and we are avoiding considerable short-term volatility.
  • CTM160314sS&P 500 (Mar. feature): The S&P 500 broke out on Friday. Today’s action ended on a mild down note but not really a meaningful reversal. The sky continues to look bright. The model stock portfolio is still long.

Note: Non linear trading theme comments are based on interpretations of non-linear trading models, combined with chart price action (technical analysis).

Premium offers:

  • I am now offering reasonable rates to institutional clients. Click on the ‘Fees’ tab for more info. I have a limited number of slots to fill.
  • With deflationary forces becoming more dominant, top level, successful, investment strategies are going to become more reliant on ‘activity’ (trading). Check out ConquerTheMummy.com for trading signals that help!
  • Remember: Nonlinear trading analysis is “insider knowledge” (non-apparent) for standard technical analysis.
  • The post-mortems for the recent US dollar and the VIX featured markets have been posted. To view it select the “Forex” or “US Equity” tabs (respectively) on ConquerTheMummy.com.

GH Garrett – Veteran Market Watcher for ConquertheMummy.com  © 2015-2016, “Nonlinear signals that matter in gold (and wheat)  trading.”

March, so far, so good (SPX, GLD)


Model Notes: The S&P issued the buy on 3/08, the theoretical signal price (TSP) came in at 1989.26. Today’s trading started off weak, but buyers came in at the end of the day to settle the score at near unchanged.  On the gold side market traders were treated to two volatile days, 3/09 was down and 3/10 was up. Mummy watchers are flat so we are not getting beat up by the yellow metal. Waiting and watching.

March Rotations: Core Gold, Featured: S&P 500.

Model Portfolio Signals: GLD flat, S&P 500 buy on 3/08 (TSP= 1989.26)

Note: TSP is calculated by using the closing price of the trading day after the signal day. It is more realistic for trading calculations/evaluations.

Nonlinear Trading Themes:

  • CTM160310gGold (Mar. core market) Gold punched south, then north the last several trading days. We are flat and safe waiting for some type of significant trend to resume. GLD resistance still seems to be at 122.
  • CTM160310sS&P 500 (Mar. feature): The S&P 500 started the day off getting hit but there was not enough sellers to sustain the weakness as buyers came in the second half of the day. A close above 2010 wll signal a breakout and this is the most likely result going forward.

Note: Non linear trading theme comments are based on interpretations of non-linear trading models, combined with chart price action (technical analysis).

Premium offers:

  • I am now offering reasonable rates to institutional clients. Click on the ‘Fees’ tab for more info. I have a limited number of slots to fill.
  • With deflationary forces becoming more dominant, top level, successful, investment strategies are going to become more reliant on ‘activity’ (trading). Check out ConquerTheMummy.com for trading signals that help!
  • Remember: Nonlinear trading analysis is “insider knowledge” (non-apparent) for standard technical analysis.
  • The post-mortems for the recent US dollar and the VIX featured markets have been posted. To view it select the “Forex” or “US Equity” tabs (respectively) on ConquerTheMummy.com.

GH Garrett – Veteran Market Watcher for ConquertheMummy.com  © 2015-2016, “Nonlinear signals that matter in gold (and wheat)  trading.”

Making the move (SPX)

Model Notes: The S&P model issued a signal today, buying the uptrend on today’s weakness. Gold models are standing pat in flatland. Remember a continuation of the stock rally may not boost gold. We will se the results on this.

March Rotations: Core Gold, Featured: S&P 500.

Model Portfolio Signals: GLD flat, S&P 500 buy on 3/08 (TSP= waiting)

Note: TSP is calculated by using the closing price of the trading day after the signal day. It is more realistic for trading calculations/evaluations.

Nonlinear Trading Themes:

  • CTM160308gGold (Mar core market) Gold is bumping its head on the 122 resistance level (GLD basis). The models are not making a direction call however. Gold stays flat.
  • CTM160308sS&P 500 (Mar feature): Stocks are more interesting here with the models buying in on the daily weakness, in the direction of the trend. Hopefully, the TSP level will even be a little lower, S&P 500 indications are now skyward.

Note: Non linear trading theme comments are based on interpretations of non-linear trading models, combined with chart price action (technical analysis).

Premium offers:

  • I am now offering reasonable rates to institutional clients. Click on the ‘Fees’ tab for more info. I have a limited number of slots to fill.
  • With deflationary forces becoming more dominant, top level, successful, investment strategies are going to become more reliant on ‘activity’ (trading). Check out ConquerTheMummy.com for trading signals that help!
  • Remember: Nonlinear trading analysis is “insider knowledge” (non-apparent) for standard technical analysis.
  • The post-mortems for the recent US dollar and the VIX featured markets have been posted. To view it select the “Forex” or “US Equity” tabs (respectively) on ConquerTheMummy.com.

GH Garrett – Veteran Market Watcher for ConquertheMummy.com  © 2015-2016, “Nonlinear signals that matter in gold (and wheat)  trading.”

Four trading days in and waiting (GLD, SPX)

Model Notes: The markets we are following for March are both at the top end of the monthly range (stocks maybe a little stronger, but a little more overbought). I am waiting for some reconfirmation signal to initiate the positions for the new month.

March Rotations: Core Gold, Featured: S&P 500.

Model Portfolio Signals: GLD flat, S&P 500 flat

Note: TSP is calculated by using the closing price of the trading day after the signal day. It is more realistic for trading calculations/evaluations.

Nonlinear Trading Themes:

  • CTM160304gGold (Mar core market) Gold tried to breakout of its monthly range on Friday, but ended up reversing as stocks held up well. 122 may be near-term resistance (GLD basis). Gold model is flat.
  • CTM160304sS&P 500 (Mar feature): Stocks are holding up well but buying after a 4-day advance may not be a good trading move. A new week is coming. S&P 500 is flat.

Note: Non linear trading theme comments are based on interpretations of non-linear trading models, combined with chart price action (technical analysis).

Premium offers:

  • I am now offering reasonable rates to institutional clients. Click on the ‘Fees’ tab for more info. I have a limited number of slots to fill.
  • With deflationary forces becoming more dominant, top level, successful, investment strategies are going to become more reliant on ‘activity’ (trading). Check out ConquerTheMummy.com for trading signals that help!
  • Remember: Nonlinear trading analysis is “insider knowledge” (non-apparent) for standard technical analysis.
  • The post-mortems for the recent US dollar and the VIX featured markets have been posted. To view it select the “Forex” or “US Equity” tabs (respectively) on ConquerTheMummy.com.

GH Garrett – Veteran Market Watcher for ConquertheMummy.com  © 2015-2016, “Nonlinear signals that matter in gold (and wheat)  trading.”

A Tough, Tough Month for the Mummy (WN, TLO)

Model Notes: The equity selloff really seems to have disrupted the flow of markets in general, switching the focus to a pair of odd bedfellow (oil and Chinese equities). February was a tough month. I hope to use lessons learned for more dramatic advantage going forward in 2016!

Current Market rotation: Core: Wheat. Featured: US Bonds.

Next rotation for March: Core Gold, Featured: S&P 500.

Model Portfolio Signals: Wheat long signal 1/22 (TSP= 492), TLO Short 1/27 (TSP=72.81)

Note: TSP is calculated by using the closing price of the trading day after the signal day. It is more realistic for trading calculations/evaluations.

Nonlinear Trading Themes:

  • CTM160223wWheat (Feb core market): This is a new core market for us. Deflationary forces were not our friends on this one. We wave bye to this but will be following again in April.
  • CTM160223bUS Bonds (Feb Feature): US Bonds (TLO basis), advanced despite the Fed bias shifting to ‘tightening’ (generally bearish for debt). This market remains my white whale. Our featured market for March will be the S&P 500.

Note: Non linear trading theme comments are based on interpretations of non-linear trading models, combined with chart price action (technical analysis).

Premium offers:

  • I am now offering reasonable rates to institutional clients. Click on the ‘Fees’ tab for more info. I have a limited number of slots to fill.
  • With deflationary forces becoming more dominant, top level, successful, investment strategies are going to become more reliant on ‘activity’ (trading). Check out ConquerTheMummy.com for trading signals that help!
  • Remember: Nonlinear trading analysis is “insider knowledge” (non-apparent) for standard technical analysis.
  • The post-mortems for the recent US dollar and the VIX featured markets have been posted. To view it select the “Forex” or “US Equity” tabs (respectively) on ConquerTheMummy.com.

GH Garrett – Veteran Market Watcher for ConquertheMummy.com  © 2015-2016, “Nonlinear signals that matter in gold (and wheat)  trading.”