July-Aug Rotations: Core Mkt = GLD, Featured Mkt = TBT.
Signals: GLD = Flat (TSP= N/A), TBT= Flat (Exit long) 7/19 (TSP= waiting).
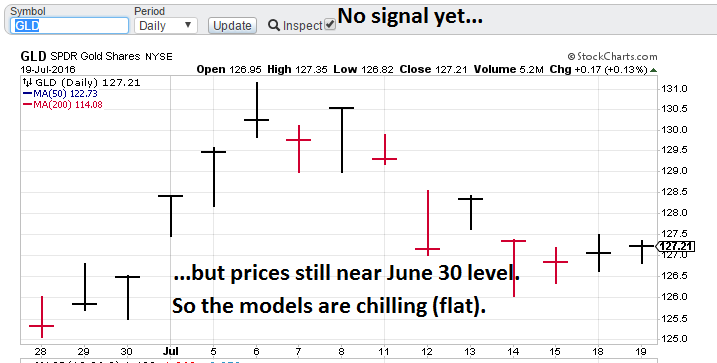
Model notes: The rate model issued a ‘flat’ signal (exit long). The market is generally higher than the 7/06 buy so this is probably going to prove to be a good trade, but we will have to wait for the TSP to get the final verdict. The gold model is not showing any action yet. On the plus side the GLD is very close to its monthly closing price on June 30. If there is no opportunity it is better to stay out before some adverse news event pops out of the closet to get your money!
Note: The TSP (theoretical Signal Price) metric is calculated by using the ‘close’ price of the trading day FOLLOWING the signal day.
Note: The following comments are based on using technical analysis to ‘flesh out’ our nonlinear trading signals.
Nonlinear Trading Themes:
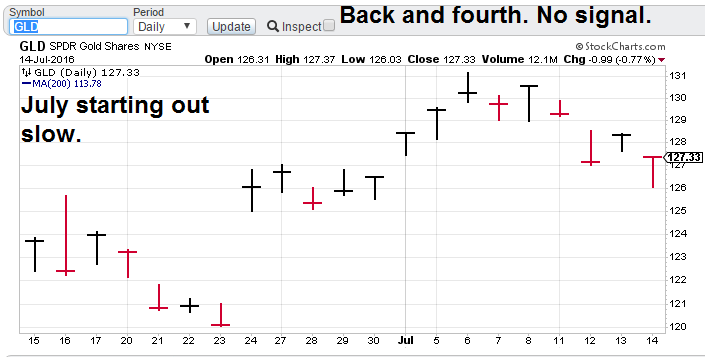
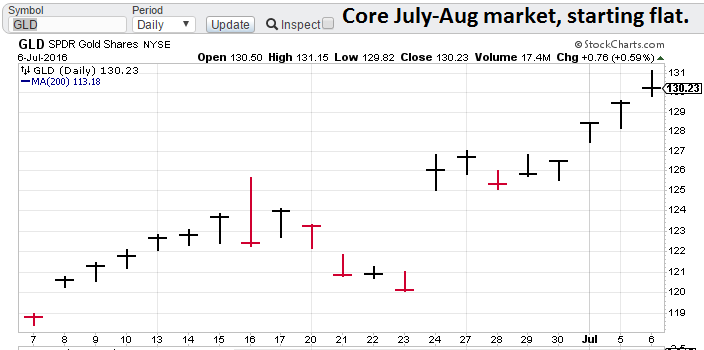
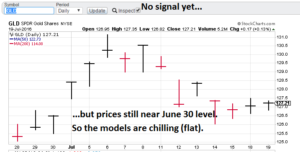 Gold Trading Signals (Core). Gold is flat for the month in terms of today’s close versus the close on June 30. The models don’t see that changing soon. The model gold portfolio is flat.
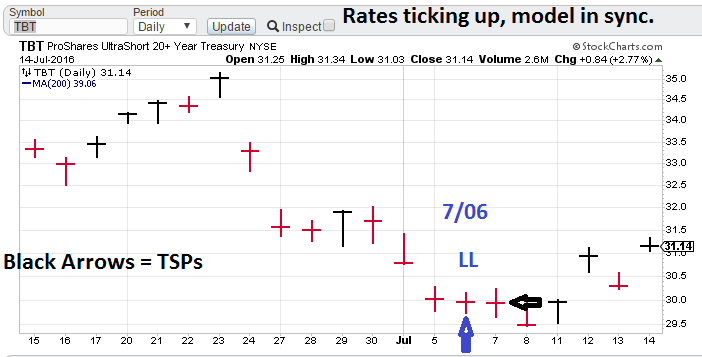
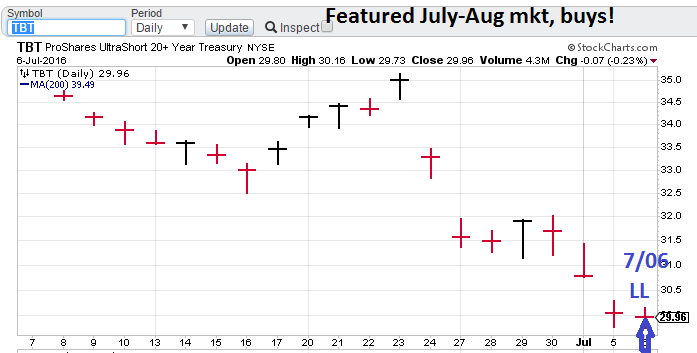
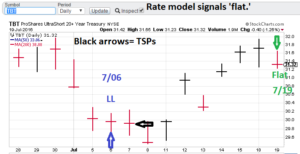 Interest Rates (Featured). The TBT (interest rates) bounced off the recent lows and moved the rate higher than the July 6 signal TSP. Today the model signaled an exit (go to flat). This plays into the general theme of anemic economic growth and the impression that the Yellen-led Fed is going to do everything NOT to act. Anyway the model interest rate portfolio is now flat.

Premium Research notes:
Observation: Don’t sit around your Monday morning meetings giving each other high-fives with a two-star fund or strategy on the books. Contact me for more info. Click the ‘Ranking’ tab to find out more. By the way, in 2016, I am only going to take on 6 clients. CTM can help and our rates are reasonable!
We are now offering asset class ranking (or alternatively sector ranking), using our trading signal technology on a longer timeframe. This is an exciting new product as portfolio construction has one glaring, missing puzzle piece: what asset classes will continue to outperform/advance for next month? Get your independent research here, put my 25+ years of model building experience to work for you!
Take a minute to peruse the US Equities tab. I posted the S&P 500 trading signals postmortem for the recent March-April time period (approx. as it took about a week to generate a signal at the beginning). Plus 134 Points. Great stuff!
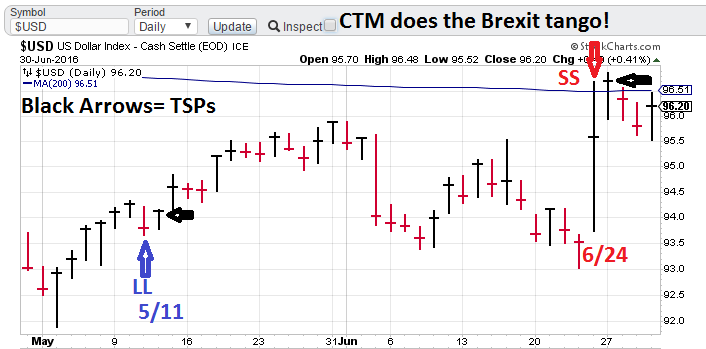
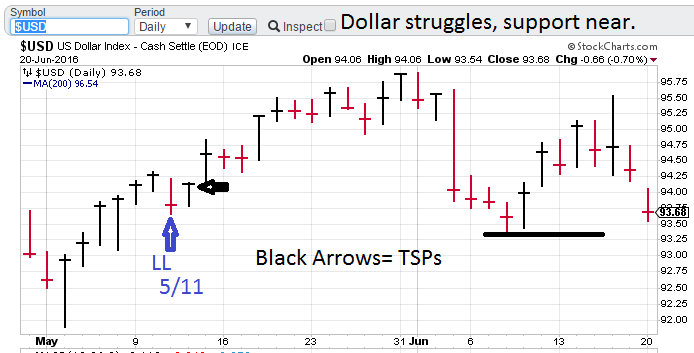
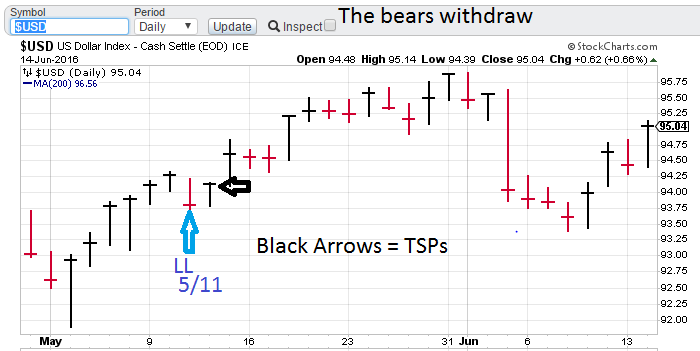
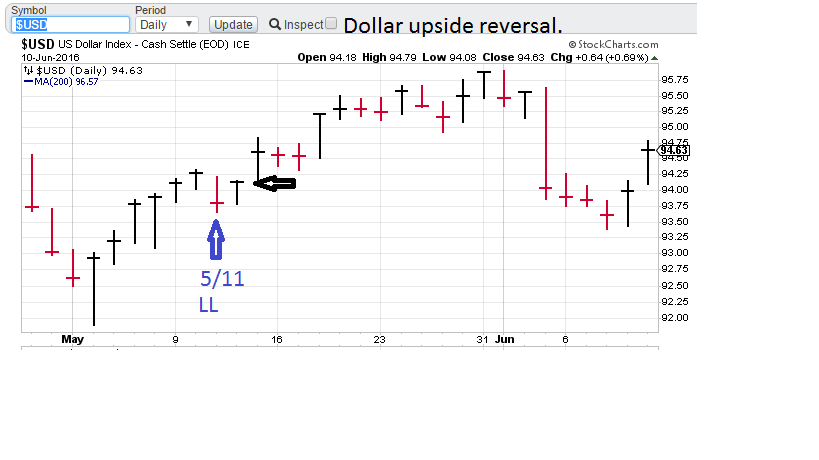
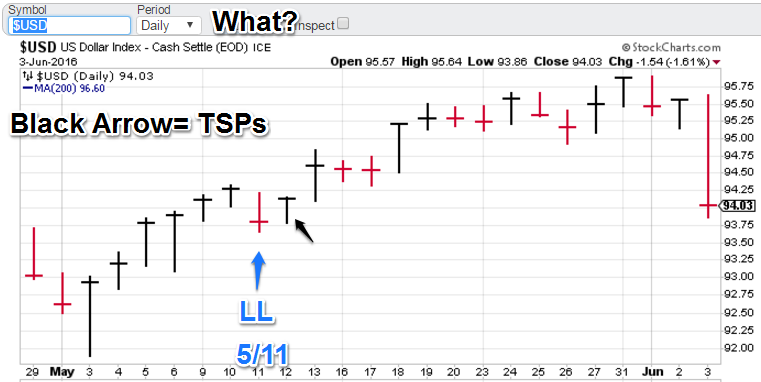
Take a minute to check out the Forex tab on our website. I am posting the recent US Dollar May-June signals. No whipsaws and playing the surprise Brexit vote just right. Great stuff!
GH Garrett – Chief Market Analyst for ConquertheMummy.com © 2015-2016, “Nonlinear trading signals that matter in gold (and interest rate) trading.”