Tag Archives: Gold trading signals

Models reverse, now positive on stocks

Current Model positions:

  • Equity buy signal date= 10/11, TSP = Waiting
  • Vix sell signal date= 10/11, TSP = waiting
  • $TNX (rates) signal date = 10/02, TSP = 23.34

Model notes: Models now confirming uptrend for blue ships.

Note: The following comments are based on using technical analysis to ‘flesh out’ our nonlinear trading signals. TSP is defined as the closing price following the signal day.

Nonlinear Trading Themes:
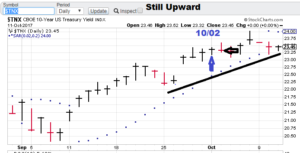
  • Bullish Yields ($TNX): Rates are still drifting upward. Models and short-term trendlines confirm this. One uncertainty now appearing in the press is speculation on Yellan’s replacement. Don’t-Rock-the-Yellan’s days as the leader of the Fed look to be coming to an end.
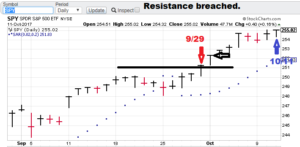
  • Bullish Trend Stocks (SPY): The previous sell signal was not very helpful and bluechips took a leg higher. The models respect the market’s strength and have now reversed. Upside is now the path of least resistance.
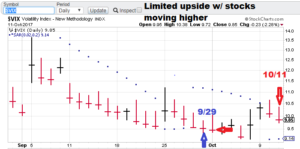
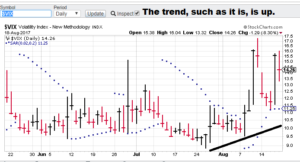
  • Bearish Trend Equity volatility ($VIX): Volatility has very limited upside with stock moving higher. We look for lower values here.

Premium Research notes:

Observation: We are changing our premium services for 2017. Stay tuned for the details of the new service to be offered. Get your independent research here, put my 25+ years of model building experience to work for you!

Take a minute to peruse the US Equities tab. I posted the S&P 500 trading signals postmortem for the recent March-April time period (approx. as it took about a week to generate a signal at the beginning). Plus 134 Points. Great stuff!

Take a minute to check out the Forex tab on our website. I am posting the recent US Dollar May-June signals. No whipsaws and playing the surprise Brexit vote just right. Great stuff!

Take a minute to take a minute to click on our bond trading tab. Our signals took the profits in the early month while holding the long interest rates position later. It never sold rates, hinting at higher rates to come. The TBT went higher outside our test window. A nice tip-off for the future!

Check out the energy tab. We tracked crude during the run up to the US presidential election. There was plenty negativity with a surprise ending. See how nonlinear analysis walked us through it!

GH Garrett – Chief Market Analyst for ConquertheMummy.com  © 2015-2017, “Nonlinear trading signals that matter in VIX trading.”
Models calling rates higher

Models:

  • Equity sell signal date= 9/29, TSP = 252.32
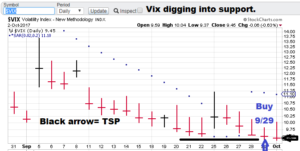
  • Vix buy signal date= 9/29, TSP = 9.45
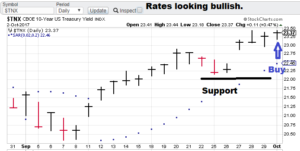
  • $TNX (rates) buy signal date = 10/02, TSP = This Tuesday’s close

Model notes: Ok, now we have the models starting to make predictions, so here we go!

Note: The following comments are based on using technical analysis to ‘flesh out’ our nonlinear trading signals. TSP is defined as the closing price following the signal day.

Nonlinear Trading Themes:

  • Neutral Yields ($TNX): Rates look to have bottomed in early Sep and are now trending up. Nonlinear analysis gave the bullish nod as of today. Rates have been compressed down for a while, the spring board is set.
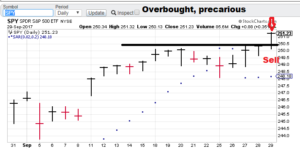
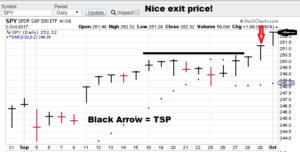
  • Short Trend Stocks (SPY): Friday’s close gave us the sell, at Monday’s closing price (TSP). In this case the models are fading an uptrend. The model read is that bluechips are over extended and a pause is now due. Vulnerable to selling!
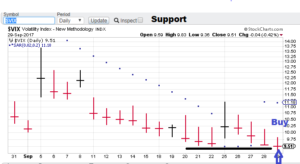
  • Buy Trend Equity volatility ($VIX): Volatility, is inverse to bluechips. Interestingly, the vix held up we despite the market rise today.


Premium Research notes:

Observation: We are changing our premium services for 2017. Stay tuned for the details of the new service to be offered. Get your independent research here, put my 25+ years of model building experience to work for you!

Take a minute to peruse the US Equities tab. I posted the S&P 500 trading signals postmortem for the recent March-April time period (approx. as it took about a week to generate a signal at the beginning). Plus 134 Points. Great stuff!

Take a minute to check out the Forex tab on our website. I am posting the recent US Dollar May-June signals. No whipsaws and playing the surprise Brexit vote just right. Great stuff!

Take a minute to take a minute to click on our bond trading tab. Our signals took the profits in the early month while holding the long interest rates position later. It never sold rates, hinting at higher rates to come. The TBT went higher outside our test window. A nice tip-off for the future!

Check out the energy tab. We tracked crude during the run up to the US presidential election. There was plenty negativity with a surprise ending. See how nonlinear analysis walked us through it!

GH Garrett – Chief Market Analyst for ConquertheMummy.com  © 2015-2017, “Nonlinear trading signals that matter in VIX trading.”
A sell in bluechips!

Model sell signal date 9/29. TSP = close on the next trading day (Monday, 10/02).

Model notes: Nonlinear models are fading the punch to new September highs in largecap equities. VIX tends to move opposite, so that signal is buying.

Note: The following comments are based on using technical analysis to ‘flesh out’ our nonlinear trading signals. TSP is defined as the closing price following the signal day.

Nonlinear Trading Themes:

  • Neutral Yields ($TNX): Waiting for guidance from the models.
  • Short Trend Stocks (SPY): This category has enjoyed a bump from the euphoria from the Trump election but sometimes even a bull has to give a little back. Nonlinear analysis has the bluechips (i.e. SPY) as overbought and vulnerable at these heights.
  • Buy Trend Equity volatility ($VIX): Volatility, the mercurial (and relatively inverse) cousin of bluechips is now in a positive mode.


Premium Research notes:

Observation: We are changing our premium services for 2017. Stay tuned for the details of the new service to be offered. Get your independent research here, put my 25+ years of model building experience to work for you!

Take a minute to peruse the US Equities tab. I posted the S&P 500 trading signals postmortem for the recent March-April time period (approx. as it took about a week to generate a signal at the beginning). Plus 134 Points. Great stuff!

Take a minute to check out the Forex tab on our website. I am posting the recent US Dollar May-June signals. No whipsaws and playing the surprise Brexit vote just right. Great stuff!

Take a minute to take a minute to click on our bond trading tab. Our signals took the profits in the early month while holding the long interest rates position later. It never sold rates, hinting at higher rates to come. The TBT went higher outside our test window. A nice tip-off for the future!

Check out the energy tab. We tracked crude during the run up to the US presidential election. There was plenty negativity with a surprise ending. See how nonlinear analysis walked us through it!

GH Garrett – Chief Market Analyst for ConquertheMummy.com  © 2015-2017, “Nonlinear trading signals that matter in VIX trading.”
Back in action

I am returning with my nonlinear signals, following a consulting theme (i.e. dropping the micro hedge fund) pretty much as the heritage of the website. Posting signals for select markets, based on nonlinear models.

This cycle (through Dec 31), I will be tracking the S&P 500, interest rates ($TNX) and the volatility index ($VIX). These three should be of more than casual interest for a wide range of market followers.

Model notes: I post signals when they occur, but since I am re-starting (since my schedule now permits it) between signals, I am giving the general nonlinear ‘in progress signals’.  I am awaiting either change-of-trend or reconfirming signals.

Note: The following comments are based on using technical analysis to ‘flesh out’ our nonlinear trading signals.

Nonlinear Trading Themes:

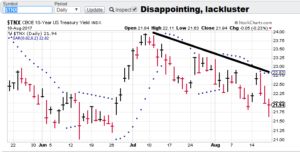
  • Short Yields ($TNX): This market has been such a disappointment for yield bulls. The heady talk of increased economic activity (Trump election) leading to increased inflation and the Fed aggressively pushing the “hike” button just seems to have sagged for now. The general press seems apoplectic concerning Trump (moving from Russian conspiracies to the protests/brawling surrounding the removal of various Confederate statues). The stymied advance in rates have unsettling ramifications about the future of the US economy.
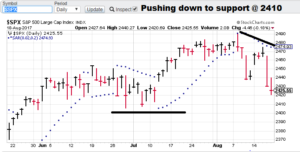
  • Short Stocks ($SPX): This category has clearly benefitted from the Trump euphoria, however even big advances must hit an occasional pause. We seem to be in one now. Nonlinear analysis is currently pointing down but near-term support is nearby (2410), so we have to see how this goes.
  • Equity volatility ($VIX): Volatility, the mercurial (and relatively inverse) cousin of bluechips is the 3rd . Anticipating this market is key to making this work as a trading vehicle. Nonlinear analysis should be a powerful tool for this type of trading problem.


Premium Research notes:

Observation: We are changing our premium services for 2017. Stay tuned for the details of the new service to be offered. Get your independent research here, put my 25+ years of model building experience to work for you!

Take a minute to peruse the US Equities tab. I posted the S&P 500 trading signals postmortem for the recent March-April time period (approx. as it took about a week to generate a signal at the beginning). Plus 134 Points. Great stuff!

Take a minute to check out the Forex tab on our website. I am posting the recent US Dollar May-June signals. No whipsaws and playing the surprise Brexit vote just right. Great stuff!

Take a minute to take a minute to click on our bond trading tab. Our signals took the profits in the early month while holding the long interest rates position later. It never sold rates, hinting at higher rates to come. The TBT went higher outside our test window. A nice tip-off for the future!

Check out the energy tab. We tracked crude during the run up to the US presidential election. There was plenty negativity with a surprise ending. See how nonlinear analysis walked us through it!

GH Garrett – Chief Market Analyst for ConquertheMummy.com  © 2015-2017, “Nonlinear trading signals that matter in gold trading.”

Moving on up, CTM hedge fund

Hedge Fund stats: Start Date= 2/28, Total start value= $20,088.93. Current holdings TBT (450 shares, current price $41.72, total value=$21,434.45). Inception-to-date = +6.70% (less than a month!).

Model notes: Initially the models had to help us answer 2 questions, choose an asset class, choose a direction. How did we do? The models signaled bonds with the direction down (put another way, long yields, hence the TBT). The charts below indicate we made the right choice. There is a cherry on the sundae as well. Last week on CNBC, Melissa Lee questioned hot-hand-manager David Tepper as to whether he was short bonds. Tepper’s terse response was, “You bet your hiney!” Nonlinear analysis has us on the same side of the bond market as David Tepper.

Note: The following comments are based on using technical analysis to ‘flesh out’ our nonlinear trading signals.

Nonlinear Trading Themes:

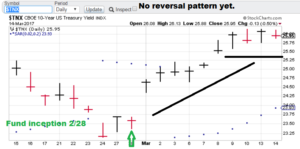
  • Long Yields ($TNX): Yields continue to climb, and that is great. The $TNX is now near the highs of December (26.25-ish). So now what? Nonlinear analysis is still bullish. If you look at this as a trading range, the advantage is with the rate bulls. Other factors to consider are: the Fed is now hawkish on rates and Trump-o-nomics is adding a lot of enthusiasm about an economic rebound. The position looks good.
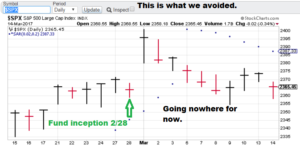
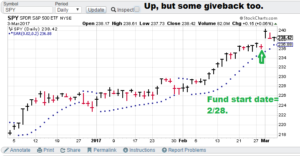
  • Neutral Stocks (counter factual, $SPX): Bluchips jumped on the first day of March but has been met with low amplitude selling since. You are starting to see some in the media start to pose this may be a reversal. My indicators are not showing that yet, instead we are simply pausing after a considerable, earlier bounce.


Premium Research notes:

Observation: We are changing our premium services for 2017. Stay tuned for the details of the new service to be offered. Get your independent research here, put my 25+ years of model building experience to work for you!

Take a minute to peruse the US Equities tab. I posted the S&P 500 trading signals postmortem for the recent March-April time period (approx. as it took about a week to generate a signal at the beginning). Plus 134 Points. Great stuff!

Take a minute to check out the Forex tab on our website. I am posting the recent US Dollar May-June signals. No whipsaws and playing the surprise Brexit vote just right. Great stuff!

Take a minute to take a minute to click on our bond trading tab. Our signals took the profits in the early month while holding the long interest rates position later. It never sold rates, hinting at higher rates to come. The TBT went higher outside our test window. A nice tip-off for the future!

Check out the energy tab. We tracked crude during the run up to the US presidential election. There was plenty negativity with a surprise ending. See how nonlinear analysis walked us through it!

GH Garrett – Chief Market Analyst for ConquertheMummy.com  © 2015-2017, “Nonlinear trading signals that matter in gold trading.”

First week, CTM hedge fund

Hedge Fund stats: Start Date= 2/28, Total start value= $20,088.93. Current holdings TBT (450 shares, current price $40.18, total value=$20,741.45). YTD return (Also inception-to-date) = +3.25% (less than a week!).

Model notes: Interest rates advanced sending the fund up. +3.25% is a good 3-day start. Nonlinear analysis is still on our side.

Note: The following comments are based on using technical analysis to ‘flesh out’ our nonlinear trading signals.

Nonlinear Trading Themes:

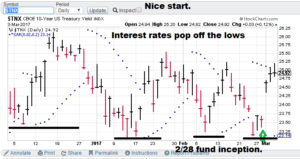
  • Long Yields ($TNX): The pop in government rates was helped by both technical and nonlinear analysis. The TA is the result of a range bound market bouncing off the bottom of the range. Nonlinear analysis shows the “risk” of a breakout is greater than a breakdown. Add in the fundamental backdrop of the Fed becoming increasingly hawkish and the perceived business pros of Trump-o-nomics, the position looks good.
  • Neutral Stocks (counter factual, SPY): Bluchips jumped but also fell on some selling. Initially the choice of going long interest rates on a pull back vs the possibility of going long overbought stocks seems … smart.


Premium Research notes:

Observation: We are changing our premium services for 2017. Stay tuned for the details of the new service to be offered. Get your independent research here, put my 25+ years of model building experience to work for you!

Take a minute to peruse the US Equities tab. I posted the S&P 500 trading signals postmortem for the recent March-April time period (approx. as it took about a week to generate a signal at the beginning). Plus 134 Points. Great stuff!

Take a minute to check out the Forex tab on our website. I am posting the recent US Dollar May-June signals. No whipsaws and playing the surprise Brexit vote just right. Great stuff!

Take a minute to take a minute to click on our bond trading tab. Our signals took the profits in the early month while holding the long interest rates position later. It never sold rates, hinting at higher rates to come. The TBT went higher outside our test window. A nice tip-off for the future!

Check out the energy tab. We tracked crude during the run up to the US presidential election. There was plenty negativity with a surprise ending. See how nonlinear analysis walked us through it!

GH Garrett – Chief Market Analyst for ConquertheMummy.com  © 2015-2017, “Nonlinear trading signals that matter in gold trading.”

Introducing the CTM hedge fund

Hedge Fund stats: Start Date= 2/28, Total value= $20,088.93 (86.76% invested, 13.24% cash), holdings TBT (450 shares, current price $38.73). YTD return= 0%.

Model notes: The general strategy is to bounce the portfolio between cash and several major asset classes. Currently I am tracking stocks (S&P 500) and Government bonds (or yields). We could see several more to follow. The current portfolio is heavily bullish government yields.

Note: The following comments are based on using technical analysis to ‘flesh out’ our nonlinear trading signals.

Nonlinear Trading Themes:

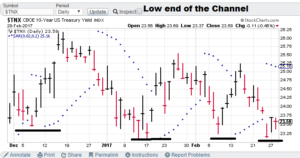
  • Long Yields ($TNX): When you are investing, you look at the past but you must envision the future. Yields are at the low end of a range they have been bouncing around in during the last 3 months. Fundamentals are a plus here too, Fed sees higher rates and the economy feels like it might be revving up. Upside potential here.
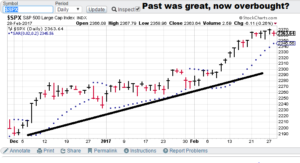
  • Neutral Stocks (counter factual, SPY): Stocks have been trending up for the last 3 months. They may very well go higher, but equities could underperform as they have already moved strongly up. Yields to out perform?


Premium Research notes:

Observation: Is it just me, or would our premium ranking signals make a great (moderately priced) addition to any hedge fund strategy? Don’t sit around your Monday morning meetings giving each other high-fives with a two-star strategy on the books. Nonlinear portfolio construction can give you an edge. Contact me for more info. Click the ‘Ranking’ tab to find out additional info. By the way, in 2017, I am only going to take on 4 clients!

We are now offering asset class ranking (or alternatively sector ranking), using our trading signal technology on a longer timeframe. This is an exciting new product as portfolio construction has one glaring, missing puzzle piece: what asset classes will continue to outperform/advance for next month? Get your independent research here, put my 25+ years of model building experience to work for you!

Take a minute to peruse the US Equities tab. I posted the S&P 500 trading signals postmortem for the recent March-April time period (approx. as it took about a week to generate a signal at the beginning). Plus 134 Points. Great stuff!

Take a minute to check out the Forex tab on our website. I am posting the recent US Dollar May-June signals. No whipsaws and playing the surprise Brexit vote just right. Great stuff!

Take a minute to take a minute to click on our bond trading tab. Our signals took the profits in the early month while holding the long interest rates position later. It never sold rates, hinting at higher rates to come. The TBT went higher outside our test window. A nice tip-off for the future!

Check out the energy tab. We tracked crude during the run up to the US presidential election. There was plenty negativity with a surprise ending. See how nonlinear analysis walked us through it!

GH Garrett – Chief Market Analyst for ConquertheMummy.com  © 2015-2017, “Nonlinear trading signals that matter in gold trading.”

A Tough Finish for January, Hiatus for February. (gld)

Dec-Jan Rotations: Core Mkt = Gold, Featured Mkt = Asset class Portfolio.

Signals: Gld = Sell 01/06 (TSP= 112.67), AC Portfolio= bought 12/29, Sea-Change status= Reconfirm.

Model notes: The gold signals were not bad but losing the 3-day rally (against our short) at the end of the month was a tough thing. We are going on hiatus for the Month of February. Our premium service will continue without pause. To the rest, I say, “See you in March!”

Note: ALL Mummy calculations use the TSP (Theoretical Signal Price)! The TSP metric is calculated by using the ‘close’ price of the trading day FOLLOWING the signal day (giving you plenty of time to take the signal).

Note: The following comments are based on using technical analysis to ‘flesh out’ our nonlinear trading signals.

Nonlinear Trading Themes:

  • Gold Trading Signals (Core).
  • Asset Class Portfolio (Featured).


Premium Research notes:

Observation: Is it just me, or would our premium ranking signals make a great (moderately priced) addition to any hedge fund strategy? Don’t sit around your Monday morning meetings giving each other high-fives with a two-star strategy on the books. Nonlinear portfolio construction can give you an edge. Contact me for more info. Click the ‘Ranking’ tab to find out additional info. By the way, in 2017, I am only going to take on 4 clients!

We are now offering asset class ranking (or alternatively sector ranking), using our trading signal technology on a longer timeframe. This is an exciting new product as portfolio construction has one glaring, missing puzzle piece: what asset classes will continue to outperform/advance for next month? Get your independent research here, put my 25+ years of model building experience to work for you!

Take a minute to peruse the US Equities tab. I posted the S&P 500 trading signals postmortem for the recent March-April time period (approx. as it took about a week to generate a signal at the beginning). Plus 134 Points. Great stuff!

Take a minute to check out the Forex tab on our website. I am posting the recent US Dollar May-June signals. No whipsaws and playing the surprise Brexit vote just right. Great stuff!

Take a minute to take a minute to click on our bond trading tab. Our signals took the profits in the early month while holding the long interest rates position later. It never sold rates, hinting at higher rates to come. The TBT went higher outside our test window. A nice tip-off for the future!

Check out the energy tab. We tracked crude during the run up to the US presidential election. There was plenty negativity with a surprise ending. See how nonlinear analysis walked us through it!

GH Garrett – Chief Market Analyst for ConquertheMummy.com  © 2015-2017, “Nonlinear trading signals that matter in gold trading.”

A gold sell! (gld)

Dec-Jan Rotations: Core Mkt = Gold, Featured Mkt = Asset class Portfolio.

Signals: Gld = Sell 01/06 (TSP= Waiting), AC Portfolio= bought 12/29, Sea-Change status= Reconfirm.

Model notes: Gold model issued a sell, and this looks to reverse a profitable long signal (on a swing-trade type of time frame. The asset class ranking portfolio is rumbling along, positive but a little behind the control portfolio, thanks to this week’s bond rally. We expect bonds to sell off soon.

Note: ALL Mummy calculations use the TSP (Theoretical Signal Price)! The TSP metric is calculated by using the ‘close’ price of the trading day FOLLOWING the signal day (giving you plenty of time to take the signal).

Note: The following comments are based on using technical analysis to ‘flesh out’ our nonlinear trading signals.

Nonlinear Trading Themes:

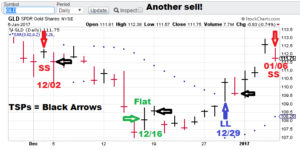
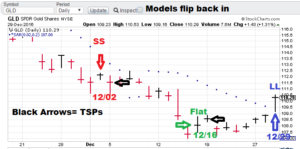
  • Gold Trading Signals (Core). The models are now indicating the bull bounce is over. We have a “short” signal after the 12/29 “buy,” and it looks to be a positive trade (we must wait for the TSP to be sure). With an environment of increasing rates and a solid currency, the backdrop for a sustained upward move for gold does not seem likely. So far, so good.
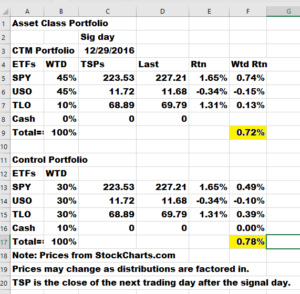
  • Asset Class Portfolio (Featured). The rebalance point proved good (near the two-week lows on the SPY) and thus the portfolio is positive. However, the recent rally of the bond market has us underperforming the control portfolio by a modest 6 basis points (for about a week). We do not expect bond rally to go much further. The portfolio asset classes are: SPY (stocks), TLO (bonds) and USO (energy). We are displaying the CTM portfolio as well as a control (balanced) portfolio for comparison.


Premium Research notes:

Observation: Is it just me, or would our premium ranking signals make a great (moderately priced) addition to any hedge fund strategy? Don’t sit around your Monday morning meetings giving each other high-fives with a two-star strategy on the books. Nonlinear portfolio construction can give you an edge. Contact me for more info. Click the ‘Ranking’ tab to find out additional info. By the way, in 2017, I am only going to take on 4 clients!

We are now offering asset class ranking (or alternatively sector ranking), using our trading signal technology on a longer timeframe. This is an exciting new product as portfolio construction has one glaring, missing puzzle piece: what asset classes will continue to outperform/advance for next month? Get your independent research here, put my 25+ years of model building experience to work for you!

Take a minute to peruse the US Equities tab. I posted the S&P 500 trading signals postmortem for the recent March-April time period (approx. as it took about a week to generate a signal at the beginning). Plus 134 Points. Great stuff!

Take a minute to check out the Forex tab on our website. I am posting the recent US Dollar May-June signals. No whipsaws and playing the surprise Brexit vote just right. Great stuff!

Take a minute to take a minute to click on our bond trading tab. Our signals took the profits in the early month while holding the long interest rates position later. It never sold rates, hinting at higher rates to come. The TBT went higher outside our test window. A nice tip-off for the future!

Check out the energy tab. We tracked crude during the run up to the US presidential election. There was plenty negativity with a surprise ending. See how nonlinear analysis walked us through it!

GH Garrett – Chief Market Analyst for ConquertheMummy.com  © 2015-2017, “Nonlinear trading signals that matter in gold trading.”

Asset class Ranking set! (Portfolio)

Dec-Jan Rotations: Core Mkt = Gold, Featured Mkt = Asset class Portfolio.

Signals: Gld = Buy 12/29 (TSP= Waiting), AC Portfolio= bought 12/29

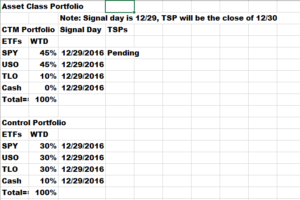
Model notes: We are releasing (first time ever) the sample asset class ranking portfolio. The signal day is 12/29 and the TSP will be the close of 12/20. Since this is a sample of the premium product, we are excited and looking for forward to the performance numbers in January. Remember if the models dictate, we could have a rebalance between now and Jan 31 (the last trading day in January). The gold model also registered a buy. The exit to flat signal on gold proved a good signal but now the models are calling a “buy” indicating some type of bottom is now in.

Note: ALL Mummy calculations use the TSP (Theoretical Signal Price)! The TSP metric is calculated by using the ‘close’ price of the trading day FOLLOWING the signal day (giving you plenty of time to take the signal).

Note: The following comments are based on using technical analysis to ‘flesh out’ our nonlinear trading signals.

Nonlinear Trading Themes:

  • Gold Trading Signals (Core). The selloff after the Dec 2 “sell” signal and the later “flat” signal (Dec 16) worked well for us. The models are now signaling a “buy” and the clear inference is the recent bottom at 107.50 (GLD basis) is going to be significant.
  • Asset Class Portfolio (Featured). We are posting the buy-in of the CTM sample asset class portfolio ranking. (Do I hear the faint, “It’s about time!”) I wanted to get a reconfirmation before hitting the button and we now have it. The rankings indicate the continuation of the Trump-trade (stocks heading up and bonds on the defensive). What about the Dec 28 selloff? The models are not seeing this as a game changer yet. I have listed three asset classes: SPY (stocks), TLO (bonds) and USO (energy) as well as a control (balanced) portfolio for comparison.


Premium Research notes:

Observation: Is it just me, or would our premium ranking signals make a great (moderately priced) addition to any hedge fund strategy? Don’t sit around your Monday morning meetings giving each other high-fives with a two-star strategy on the books. Nonlinear portfolio construction can give you an edge. Contact me for more info. Click the ‘Ranking’ tab to find out additional info. By the way, in 2017, I am only going to take on 4 clients!

We are now offering asset class ranking (or alternatively sector ranking), using our trading signal technology on a longer timeframe. This is an exciting new product as portfolio construction has one glaring, missing puzzle piece: what asset classes will continue to outperform/advance for next month? Get your independent research here, put my 25+ years of model building experience to work for you!

Take a minute to peruse the US Equities tab. I posted the S&P 500 trading signals postmortem for the recent March-April time period (approx. as it took about a week to generate a signal at the beginning). Plus 134 Points. Great stuff!

Take a minute to check out the Forex tab on our website. I am posting the recent US Dollar May-June signals. No whipsaws and playing the surprise Brexit vote just right. Great stuff!

Take a minute to take a minute to click on our bond trading tab. Our signals took the profits in the early month while holding the long interest rates position later. It never sold rates, hinting at higher rates to come. The TBT went higher outside our test window. A nice tip-off for the future!

Check out the energy tab. We tracked crude during the run up to the US presidential election. There was plenty negativity with a surprise ending. See how nonlinear analysis walked us through it!

GH Garrett – Chief Market Analyst for ConquertheMummy.com  © 2015-2016, “Nonlinear trading signals that matter in gold trading.”