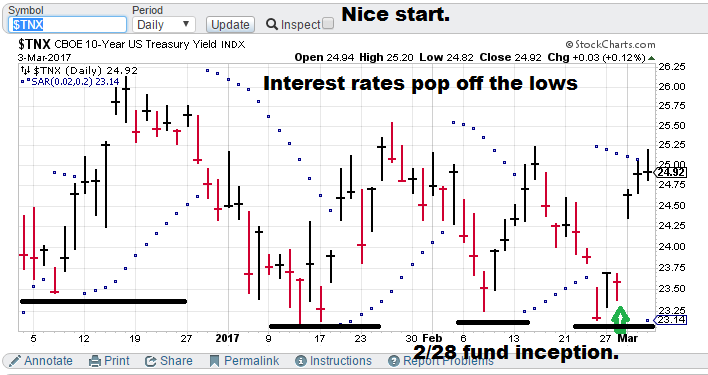
Hedge Fund stats: Start Date= 2/28, Total start value= $20,088.93. Current holdings TBT (450 shares, current price $40.18, total value=$20,741.45). YTD return (Also inception-to-date) = +3.25% (less than a week!).
Model notes: Interest rates advanced sending the fund up. +3.25% is a good 3-day start. Nonlinear analysis is still on our side.
Note: The following comments are based on using technical analysis to ‘flesh out’ our nonlinear trading signals.
Nonlinear Trading Themes:
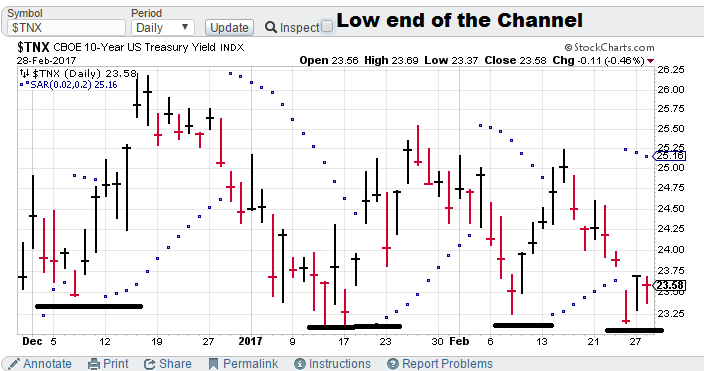
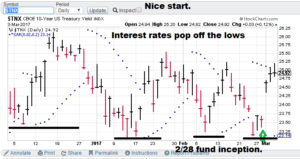 Long Yields ($TNX): The pop in government rates was helped by both technical and nonlinear analysis. The TA is the result of a range bound market bouncing off the bottom of the range. Nonlinear analysis shows the “risk” of a breakout is greater than a breakdown. Add in the fundamental backdrop of the Fed becoming increasingly hawkish and the perceived business pros of Trump-o-nomics, the position looks good.
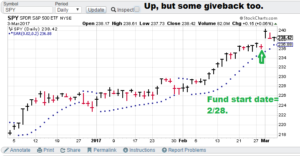 Neutral Stocks (counter factual, SPY): Bluchips jumped but also fell on some selling. Initially the choice of going long interest rates on a pull back vs the possibility of going long overbought stocks seems … smart.
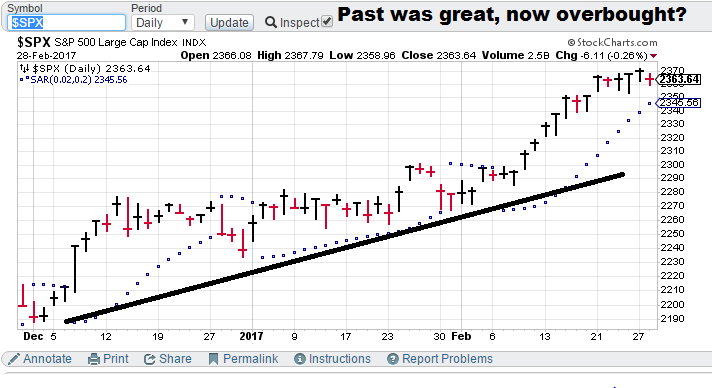

Premium Research notes:
Observation: We are changing our premium services for 2017. Stay tuned for the details of the new service to be offered. Get your independent research here, put my 25+ years of model building experience to work for you!
Take a minute to peruse the US Equities tab. I posted the S&P 500 trading signals postmortem for the recent March-April time period (approx. as it took about a week to generate a signal at the beginning). Plus 134 Points. Great stuff!
Take a minute to check out the Forex tab on our website. I am posting the recent US Dollar May-June signals. No whipsaws and playing the surprise Brexit vote just right. Great stuff!
Take a minute to take a minute to click on our bond trading tab. Our signals took the profits in the early month while holding the long interest rates position later. It never sold rates, hinting at higher rates to come. The TBT went higher outside our test window. A nice tip-off for the future!
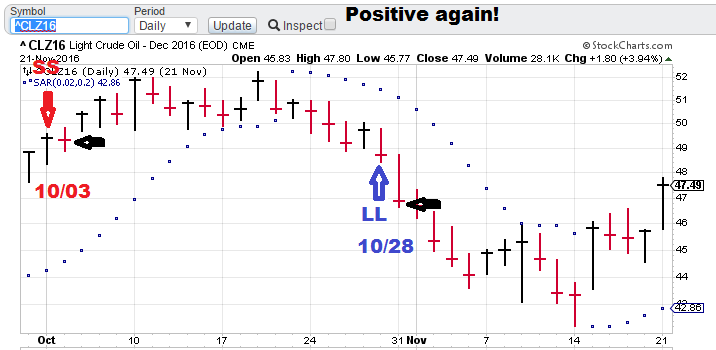
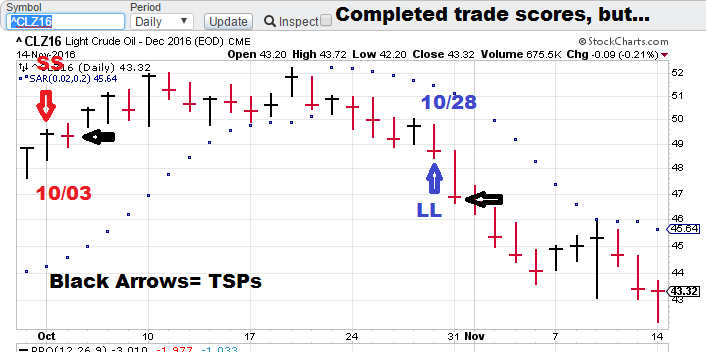
Check out the energy tab. We tracked crude during the run up to the US presidential election. There was plenty negativity with a surprise ending. See how nonlinear analysis walked us through it!
GH Garrett – Chief Market Analyst for ConquertheMummy.com © 2015-2017, “Nonlinear trading signals that matter in gold trading.”