Tag Archives: Wheat Trading signals

March, so far, so good (SPX, GLD)


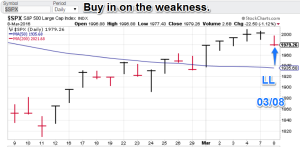
Model Notes: The S&P issued the buy on 3/08, the theoretical signal price (TSP) came in at 1989.26. Today’s trading started off weak, but buyers came in at the end of the day to settle the score at near unchanged.  On the gold side market traders were treated to two volatile days, 3/09 was down and 3/10 was up. Mummy watchers are flat so we are not getting beat up by the yellow metal. Waiting and watching.

March Rotations: Core Gold, Featured: S&P 500.

Model Portfolio Signals: GLD flat, S&P 500 buy on 3/08 (TSP= 1989.26)

Note: TSP is calculated by using the closing price of the trading day after the signal day. It is more realistic for trading calculations/evaluations.

Nonlinear Trading Themes:
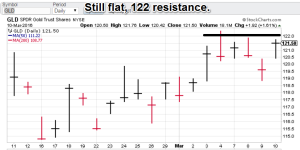
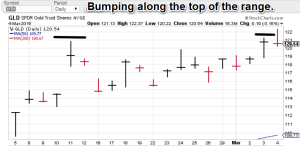
  • CTM160310gGold (Mar. core market) Gold punched south, then north the last several trading days. We are flat and safe waiting for some type of significant trend to resume. GLD resistance still seems to be at 122.
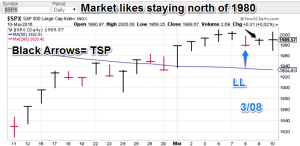
  • CTM160310sS&P 500 (Mar. feature): The S&P 500 started the day off getting hit but there was not enough sellers to sustain the weakness as buyers came in the second half of the day. A close above 2010 wll signal a breakout and this is the most likely result going forward.

Note: Non linear trading theme comments are based on interpretations of non-linear trading models, combined with chart price action (technical analysis).

Premium offers:

  • I am now offering reasonable rates to institutional clients. Click on the ‘Fees’ tab for more info. I have a limited number of slots to fill.
  • With deflationary forces becoming more dominant, top level, successful, investment strategies are going to become more reliant on ‘activity’ (trading). Check out ConquerTheMummy.com for trading signals that help!
  • Remember: Nonlinear trading analysis is “insider knowledge” (non-apparent) for standard technical analysis.
  • The post-mortems for the recent US dollar and the VIX featured markets have been posted. To view it select the “Forex” or “US Equity” tabs (respectively) on ConquerTheMummy.com.

GH Garrett – Veteran Market Watcher for ConquertheMummy.com  © 2015-2016, “Nonlinear signals that matter in gold (and wheat)  trading.”
Making the move (SPX)

Model Notes: The S&P model issued a signal today, buying the uptrend on today’s weakness. Gold models are standing pat in flatland. Remember a continuation of the stock rally may not boost gold. We will se the results on this.

March Rotations: Core Gold, Featured: S&P 500.

Model Portfolio Signals: GLD flat, S&P 500 buy on 3/08 (TSP= waiting)

Note: TSP is calculated by using the closing price of the trading day after the signal day. It is more realistic for trading calculations/evaluations.

Nonlinear Trading Themes:

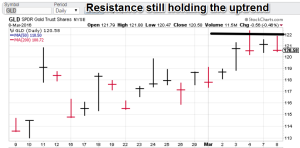
  • CTM160308gGold (Mar core market) Gold is bumping its head on the 122 resistance level (GLD basis). The models are not making a direction call however. Gold stays flat.
  • CTM160308sS&P 500 (Mar feature): Stocks are more interesting here with the models buying in on the daily weakness, in the direction of the trend. Hopefully, the TSP level will even be a little lower, S&P 500 indications are now skyward.

Note: Non linear trading theme comments are based on interpretations of non-linear trading models, combined with chart price action (technical analysis).

Premium offers:

  • I am now offering reasonable rates to institutional clients. Click on the ‘Fees’ tab for more info. I have a limited number of slots to fill.
  • With deflationary forces becoming more dominant, top level, successful, investment strategies are going to become more reliant on ‘activity’ (trading). Check out ConquerTheMummy.com for trading signals that help!
  • Remember: Nonlinear trading analysis is “insider knowledge” (non-apparent) for standard technical analysis.
  • The post-mortems for the recent US dollar and the VIX featured markets have been posted. To view it select the “Forex” or “US Equity” tabs (respectively) on ConquerTheMummy.com.

GH Garrett – Veteran Market Watcher for ConquertheMummy.com  © 2015-2016, “Nonlinear signals that matter in gold (and wheat)  trading.”
Four trading days in and waiting (GLD, SPX)

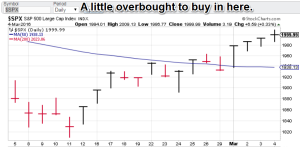
Model Notes: The markets we are following for March are both at the top end of the monthly range (stocks maybe a little stronger, but a little more overbought). I am waiting for some reconfirmation signal to initiate the positions for the new month.

March Rotations: Core Gold, Featured: S&P 500.

Model Portfolio Signals: GLD flat, S&P 500 flat

Note: TSP is calculated by using the closing price of the trading day after the signal day. It is more realistic for trading calculations/evaluations.

Nonlinear Trading Themes:

  • CTM160304gGold (Mar core market) Gold tried to breakout of its monthly range on Friday, but ended up reversing as stocks held up well. 122 may be near-term resistance (GLD basis). Gold model is flat.
  • CTM160304sS&P 500 (Mar feature): Stocks are holding up well but buying after a 4-day advance may not be a good trading move. A new week is coming. S&P 500 is flat.

Note: Non linear trading theme comments are based on interpretations of non-linear trading models, combined with chart price action (technical analysis).

Premium offers:

  • I am now offering reasonable rates to institutional clients. Click on the ‘Fees’ tab for more info. I have a limited number of slots to fill.
  • With deflationary forces becoming more dominant, top level, successful, investment strategies are going to become more reliant on ‘activity’ (trading). Check out ConquerTheMummy.com for trading signals that help!
  • Remember: Nonlinear trading analysis is “insider knowledge” (non-apparent) for standard technical analysis.
  • The post-mortems for the recent US dollar and the VIX featured markets have been posted. To view it select the “Forex” or “US Equity” tabs (respectively) on ConquerTheMummy.com.

GH Garrett – Veteran Market Watcher for ConquertheMummy.com  © 2015-2016, “Nonlinear signals that matter in gold (and wheat)  trading.”
A Tough, Tough Month for the Mummy (WN, TLO)

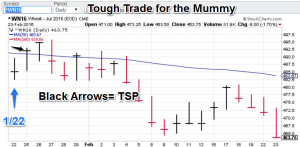
Model Notes: The equity selloff really seems to have disrupted the flow of markets in general, switching the focus to a pair of odd bedfellow (oil and Chinese equities). February was a tough month. I hope to use lessons learned for more dramatic advantage going forward in 2016!

Current Market rotation: Core: Wheat. Featured: US Bonds.

Next rotation for March: Core Gold, Featured: S&P 500.

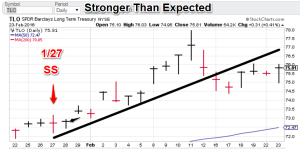
Model Portfolio Signals: Wheat long signal 1/22 (TSP= 492), TLO Short 1/27 (TSP=72.81)

Note: TSP is calculated by using the closing price of the trading day after the signal day. It is more realistic for trading calculations/evaluations.

Nonlinear Trading Themes:

  • CTM160223wWheat (Feb core market): This is a new core market for us. Deflationary forces were not our friends on this one. We wave bye to this but will be following again in April.
  • CTM160223bUS Bonds (Feb Feature): US Bonds (TLO basis), advanced despite the Fed bias shifting to ‘tightening’ (generally bearish for debt). This market remains my white whale. Our featured market for March will be the S&P 500.

Note: Non linear trading theme comments are based on interpretations of non-linear trading models, combined with chart price action (technical analysis).

Premium offers:

  • I am now offering reasonable rates to institutional clients. Click on the ‘Fees’ tab for more info. I have a limited number of slots to fill.
  • With deflationary forces becoming more dominant, top level, successful, investment strategies are going to become more reliant on ‘activity’ (trading). Check out ConquerTheMummy.com for trading signals that help!
  • Remember: Nonlinear trading analysis is “insider knowledge” (non-apparent) for standard technical analysis.
  • The post-mortems for the recent US dollar and the VIX featured markets have been posted. To view it select the “Forex” or “US Equity” tabs (respectively) on ConquerTheMummy.com.

GH Garrett – Veteran Market Watcher for ConquertheMummy.com  © 2015-2016, “Nonlinear signals that matter in gold (and wheat)  trading.”
The Chart Room is Buzzing (GLD, WN, SPX and TLO)

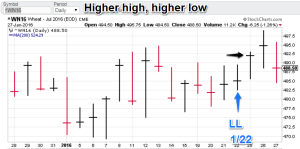
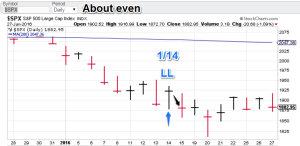
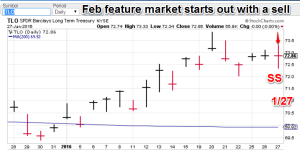
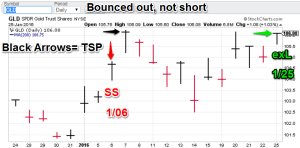
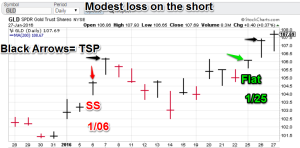
Model Notes: Gold took an unfriendly bounce on the Tuesday the 26th (the TSP day) closing the recent short out with a modest lost. I guess you can’t win them all. The S&P closed the trading day right at our TSP entry level. Stocks are struggling to gain traction. The July wheat signal is a little underwater but the signal was just issued on Friday. Finally, our bond signal goes online today with a sell signal after a day of mixed trading.

Current Market rotation: Featured S&P (US Bonds for Feb), Core market rotation:  Gold (wheat for Feb)

Model Portfolio Signals: (Gold, GLD basis) flat signal = 1/25 (TSP=107.29).The $S&P is now long 1/14 (TSP=1880.33). Wheat long signal 1/22 (TSP= 492), TLO Short 1/27 (TSP=waiting)

Note: TSP is calculated by using the closing price of the trading day after the signal day. It is more realistic for trading calculations/evaluations.

Nonlinear Trading Themes:

  • CTM160127gGold (current core market): I could tell soothing was not going right with the previous short as the prices kept advancing after a reasonable decline. The exit signal came about the same level as the sell short, however the exit day was quite strong. This core market is rotating out for Feb, but it will be back for March. Flat, flat, flat.
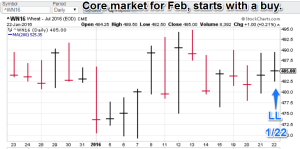
  • CTM160127wWheat (Feb core market): over the last month of trading this market has drifted up from the Jan. 7 lows. The buyers are still in control. Still long.
  • CTM160127sS&P 500 (Jan. featured market): We missed the early month decline in stocks (flat during the time), however Jan. 14 buy is struggling. We are about even for the trade (TSP level). But what does tomorrow bring? The models are long.
  • CTM160127bUS Bonds (Feb Feature): The market (TLO basis) has been moving up but recently the momentum is starting to wane. The models start this market off with a sell.

Note: Non linear trading theme comments are based on interpretations of non-linear trading models, combined with chart price action (technical analysis).

Premium offers:

  • I am now offering reasonable rates to institutional clients. Click on the ‘Fees’ tab for more info. I have a limited number of slots to fill.
  • With deflationary forces becoming more dominant, top level, successful, investment strategies are going to become more reliant on ‘activity’ (trading). Check out ConquerTheMummy.com for trading signals that help!
  • Remember: Nonlinear trading analysis is “insider knowledge” (non-apparent) for standard technical analysis.
  • The post-mortems for the recent US dollar and the VIX featured markets have been posted. To view it select the “Forex” or “US Equity” tabs (respectively) on ConquerTheMummy.com.

GH Garrett – Veteran Market Watcher for ConquertheMummy.com  © 2015-2016, “Nonlinear signals that matter in gold (and wheat)  trading.”
Bounced out, not short or long (GLD)

Model Notes: This is a quick post with just one chart (gold). I just posted based on Friday’s data. So it is one day out and only gold changed.

Current Market rotation: S&P (US Bonds for Feb), Core market rotation:  Gold (wheat for Feb)

Model Portfolio Signals: (Gold, GLD basis) exit long signal = 1/25 (TSP=waiting).The $S&P is now long 1/14 (TSP=1880.33). Wheat long signal 1/22 (TSP= 492)

Note: TSP is calculated by using the closing price of the trading day after the signal day. It is more realistic for trading calculations/evaluations.

Nonlinear Trading Themes:

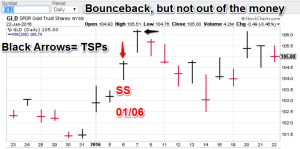
  • CTM160125gGold (current core market): The gold market rallied back to the sell level (GLD basis). If the systems were right on the downtrend we never would have made it this far up. The models figure exit long today while we figure this out.
  • Wheat (Feb core market , no chart provided): Still long.
  • S&P 500 (Jan. featured market, no chart provided): Still long.
  • US Bonds (Feb Feature, no chart provided): Waiting for a signal. Flat.

Note: Non linear trading theme comments are based on interpretations of non-linear trading models, combined with chart price action (technical analysis).

Premium offers:

  • I am now offering reasonable rates to institutional clients. Click on the ‘Fees’ tab for more info. I have a limited number of slots to fill.
  • With deflationary forces becoming more dominant, top level, successful, investment strategies are going to become more reliant on ‘activity’ (trading). Check out ConquerTheMummy.com for trading signals that help!
  • Remember: Nonlinear trading analysis is “insider knowledge” (non-apparent) for standard technical analysis.
  • The post-mortems for the recent US dollar and the VIX featured markets have been posted. To view it select the “Forex” or “US Equity” tabs (respectively) on ConquerTheMummy.com.

GH Garrett – Veteran Market Watcher for ConquertheMummy.com  © 2015-2016, “Nonlinear signals that matter in gold (and wheat)  trading.”
Gutsy Buy Paying Off (SPX)

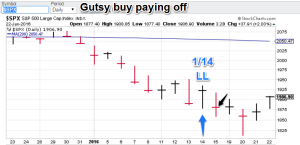
Model Notes: The S&P buy (TSP near 1880) was a gutsy call at the time but Friday’s action managed close the market north of the entry point. So we are in sync on the equities. Early week action for gold was not as helpful for the Mummy. Our sell level (over 106) was excellent but this week the yellow metal creeped back up (closing the week at 105). So we are in sync but we will be watchful this week.

Market rotation: S&P (US Bonds for Feb), Core market rotation:  Gold (wheat for Feb)

Model Portfolio Signals: (Gold, GLD basis) Sell signal = 1/06 (TSP=106.15).The $S&P is now long 1/14 (TSP=1880.33).

Note: TSP is calculated by using the closing price of the trading day after the signal day. It is more realistic for trading calculations/evaluations.

Nonlinear Trading Themes:

  • CTM160122gGold (current core market): The gold market put together a rally against the down trend not enough to take out the previous high. If stocks can hold it together, I would expect it would siphon off buyers of the yellow metal. The model gold portfolio is still short.
  • CTM160122wWheat (Feb core market): I am starting the cycle early as I have identified a buy based on Friday’s data. Here we go!
  • CTM160122sS&P 500 (Jan. featured market): We have a buy signal based on today’s data with the TSP coming based on tomorrow’s trading. The S&P 500 is very oversold and quite a bit of negative news has come out. The market is paused for a rebound here and the models are confirming this. The S&P model is now positive.
  • US Bonds (Feb Feature, no chart provided): I am very, very eager to apply my latest models to this market. Our first encounter was not the best for the Mummy. Round two is about to begin!

Note: Non linear trading theme comments are based on interpretations of non-linear trading models, combined with chart price action (technical analysis).

Premium offers:

  • I am now offering reasonable rates to institutional clients. Click on the ‘Fees’ tab for more info. I have a limited number of slots to fill.
  • With deflationary forces becoming more dominant, top level, successful, investment strategies are going to become more reliant on ‘activity’ (trading). Check out ConquerTheMummy.com for trading signals that help!
  • Remember: Nonlinear trading analysis is “insider knowledge” (non-apparent) for standard technical analysis.
  • The post-mortems for the recent US dollar and the VIX featured markets have been posted. To view it select the “Forex” or “US Equity” tabs (respectively) on ConquerTheMummy.com.

GH Garrett – Veteran Market Watcher for ConquertheMummy.com  © 2015-2016, “Nonlinear signals that matter in gold (and wheat)  trading.”
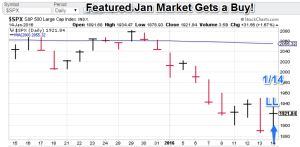
S&P 500 Gets a Buy (SPX)

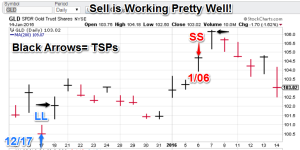
Model Notes: The gold market weakens and the theoretical signal price (TSP) ‘sell’ price proved to be the highest value for the last 30 days. The gold model is in sync. The S&P model signaled a buy today. The upcoming days will prove whether this is good but the fact the model avoided getting clobbered (it was flat) in the first week of January is enough to register the equity model to be in sync as well.

Featured market rotation: S&P (January), Core market rotation:  Gold.

Model Portfolio Signals: (Gold, GLD basis) Sell signal = 1/06 (TSP=106.15).The $S&P is now long 1/14 (TSP=waiting).

Note: TSP is calculated by using the closing price of the trading day after the signal day. It is more realistic for trading calculations/evaluations.

Nonlinear Trading Themes:

  • CTM160114gGold (current core market): The yellow metal had a tough day. If you think about it, the recent market weakness and the China economic deceleration point to disinflation and that is not great backdrop for gold. Technically, the Jan. 7 top appears intact. The model gold portfolio is short, positioned for retest of the lows of December.
  • CTM160114sS&P 500 (Jan. featured market): We have a buy signal based on today’s data with the TSP coming based on tomorrow’s trading. The S&P 500 is very oversold and quite a bit of negative news has come out. The market is paused for a rebound here and the models are confirming this. The S&P model is now positive.

Note: Non linear trading theme comments are based on interpretations of non-linear trading models, combined with chart price action (technical analysis).

Premium offers:

  • I am now offering reasonable rates to institutional clients. Click on the ‘Fees’ tab for more info. I have a limited number of slots to fill.
  • With deflationary forces becoming more dominant, top level, successful, investment strategies are going to become more reliant on ‘activity’ (trading). Check out ConquerTheMummy.com for trading signals that help!
  • Remember: Nonlinear trading analysis is “insider knowledge” (non-apparent) for standard technical analysis.
  • The post-mortems for the recent US dollar and the VIX featured markets have been posted. To view it select the “Forex” or “US Equity” tabs (respectively) on ConquerTheMummy.com.

GH Garrett – Veteran Market Watcher for ConquertheMummy.com  © 2015-2016, “Nonlinear signals that matter in gold trading.”

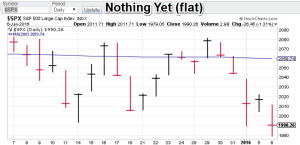
A Brutal First Week Of The Year (SPX)

A Brutal First Week Of The Year (SPX)

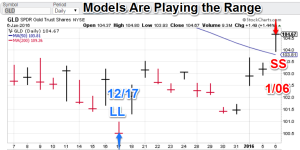
Model Notes: The gold models sold well capturing the highest theoretical signal price (TSP) value of the last 30 days. The entry TSP was definitely at the low end of the recent range. So the models for the yellow metal are on track. The S&P models were just brought online (this is the featured market for January) and are trying to gauge a brutal sell-off for the first days of the new month. Kudos for not going bullish too early.

Additional: In the past, I featured gold (in the form of the GLD fund) as a non-rotational signal chart on Conquerthemummy.com postings. I am changing the status from non-rotational to “core.” The effect is that I will be posting signal charts for gold on odd numbered months, and wheat for even months.

Featured market rotation: S&P for January! Core market is gold.

Model Portfolio Signals: (Gold, GLD basis) Sell signal = 1/06 (TSP=106.15).The $S&P is Neutral.

Note: TSP is calculated by using the closing price of the trading day after the signal day. It is more realistic for trading calculations/evaluations.

Nonlinear Trading Themes:

  • CTM160108gGold (current core market): Gold has benefitted from a series of geo-global events that popped the yellow metal high and far. The China economic slowdown, intensification of hostilities of rival Islamic factions and the North Korean nuclear tests were all factors. However the models turned bearish on Wednesday possibly indicating the fatigued bulls will be asking themselves “what else could go wrong?” Technically, the models are playing the range, selling the latest breakout. The model gold portfolio is short, positioned for fading strength.
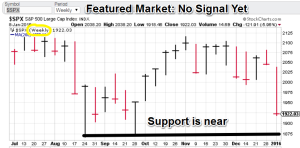
  • CTM160108sS&P 500 (Jan. featured market): I am showing a rare weekly chart on my posts. The models are flat but a couple of things are coming together. Technically the S&P is approaching the lows of August and September (1875), so support is near. Also there is some evidence of a bullish seasonality in January based in part on tax related buying following the distributions of December. An interesting bounce could be in the making and we are waiting to see if our models confirm this. The S&P model is flat.

Note: Non linear trading theme comments are based on interpretations of non-linear trading models, combined with chart price action (technical analysis).

Premium offers:

  • I am now offering a more a la carte fee system for CTM research. Purchasers can now mix and match signals on various symbols that are currently available. Click on the ‘Fees’ tab for more info.
  • With deflationary forces becoming more dominant, top level, successful, investment strategies are going to become more reliant on ‘activity’ (trading). Check out ConquerTheMummy.com for trading signals that help!
  • Remember: Nonlinear trading analysis is “insider knowledge” (non-apparent) for standard technical analysis.
  • The post-mortems for the recent US dollar and the VIX featured markets have been posted. To view it select the “Forex” or “US Equity” tabs (respectively) on ConquerTheMummy.com.

GH Garrett – Veteran Market Watcher for ConquertheMummy.com  © 2015-2016, “Nonlinear signals that matter in gold trading.”

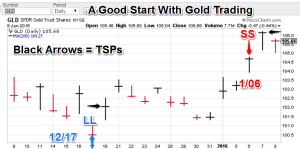
A Sell In Gold (SPX, GLD)

Model Notes: The gold models seem to be playing the range, while the S&P models are undecided. Though we don’t know what the short TSP on gold signal will be , initially it looks like a positive position is being closed out.

Additional: In the past, I featured Gold (in the form of the GLD fund) as a non-rotational signal chart on Conquerthemummy.com postings. I am changing the status from non-rotational to “core.” The effect is that I will be posting signal charts for gold on odd numbered months, and wheat for even months

Featured market rotation: S&P for January! Core market is gold.

Model Portfolio Signals: (Gold, GLD basis) Sell signal = 1/06 (TSP=waiting).The $S&P is Neutral.

Note: TSP is calculated by using the closing price of the trading day after the signal day. It is more realistic for trading calculations.

Nonlinear Trading Themes:

  • CTM160106gGold (current core market): Gold has received quite a kick start this new year with the China sell off, the North Korean nuclear test and the considerable rift in major rival Islamic sects. The models are now selling into strength (maybe thinking “what else could go wrong?”). Technically, the models are playing the range, selling the latest breakout. The model gold portfolio is now short.
  • CTM160106sS&P 500 (Jan. featured market): The selling is not yet over but it is unclear that we will go significantly lower either. The models don’t seem to be in the mood to pile on (meaning go with) the breakouts. The S&P model is flat.

Note: Non linear trading theme comments are based on interpretations of non-linear trading models, combined with chart price action (technical analysis).

Premium offers:

  • I am now offering a more a la carte fee system for CTM research. Purchasers can now mix and match signals on various symbols that are currently available. Click on the ‘Fees’ tab for more info.
  • With deflationary forces becoming more dominant, top level, successful, investment strategies are going to become more reliant on ‘activity’ (trading). Check out ConquerTheMummy.com for trading signals that help!
  • Remember: Nonlinear trading analysis is “insider knowledge” (non-apparent) for standard technical analysis.
  • The post-mortems for the recent US dollar and the VIX featured markets have been posted. To view it select the “Forex” or “US Equity” tabs (respectively) on ConquerTheMummy.com.

GH Garrett – Veteran Market Watcher for ConquertheMummy.com  © 2015, “Nonlinear signals that matter in gold trading.”