Model Notes: This is a quick post with just one chart (gold). I just posted based on Friday’s data. So it is one day out and only gold changed.
Current Market rotation: S&P (US Bonds for Feb), Core market rotation: Gold (wheat for Feb)
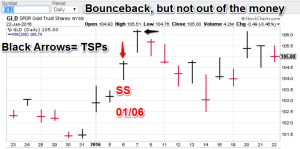
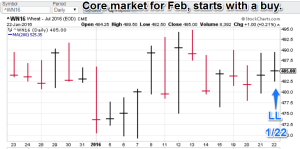
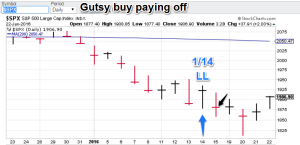
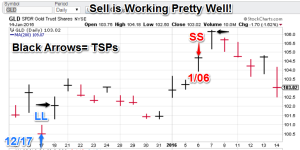
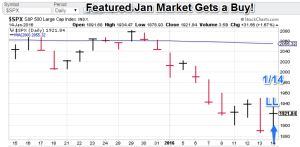
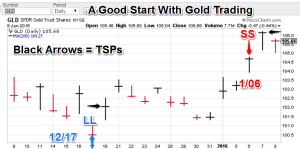
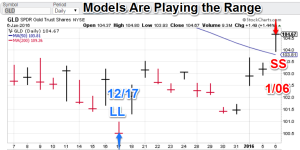
Model Portfolio Signals: (Gold, GLD basis) exit long signal = 1/25 (TSP=waiting).The $S&P is now long 1/14 (TSP=1880.33). Wheat long signal 1/22 (TSP= 492)
Note: TSP is calculated by using the closing price of the trading day after the signal day. It is more realistic for trading calculations/evaluations.
Nonlinear Trading Themes:
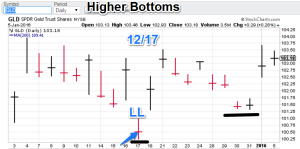
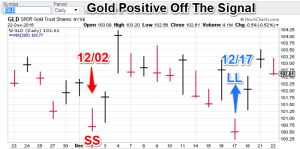
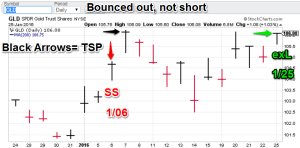 Gold (current core market): The gold market rallied back to the sell level (GLD basis). If the systems were right on the downtrend we never would have made it this far up. The models figure exit long today while we figure this out.
- Wheat (Feb core market , no chart provided): Still long.
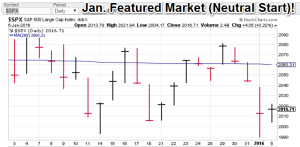
- S&P 500 (Jan. featured market, no chart provided): Still long.
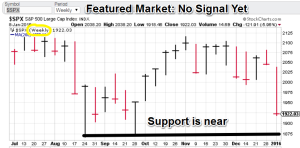
- US Bonds (Feb Feature, no chart provided): Waiting for a signal. Flat.
Note: Non linear trading theme comments are based on interpretations of non-linear trading models, combined with chart price action (technical analysis).
Premium offers:
- I am now offering reasonable rates to institutional clients. Click on the ‘Fees’ tab for more info. I have a limited number of slots to fill.
- With deflationary forces becoming more dominant, top level, successful, investment strategies are going to become more reliant on ‘activity’ (trading). Check out ConquerTheMummy.com for trading signals that help!
- Remember: Nonlinear trading analysis is “insider knowledge” (non-apparent) for standard technical analysis.
- The post-mortems for the recent US dollar and the VIX featured markets have been posted. To view it select the “Forex” or “US Equity” tabs (respectively) on ConquerTheMummy.com.
GH Garrett – Veteran Market Watcher for ConquertheMummy.com © 2015-2016, “Nonlinear signals that matter in gold (and wheat) trading.”
