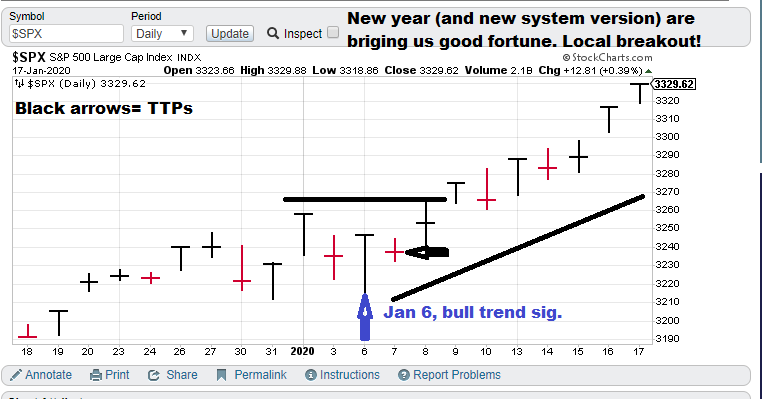
1-month (approx.) focus chart.
Current S&P 500 Prediction (slow model): $SPX (S&P 500), Bull-trend signal (01/06/20), TTP= Close of Tuesday
Current price for CTM research (signals), $20,000 per quarter for the S&P 500 “fast” nonlinear model. The faster model is more optimized for options trading.
Model notes: I am showing our 2020 trading as I have updated the system for the new year. The Jan 6 signal has us back on track. We are now seeing the market breakout and we are on it. I continue to have faith in chaotic trend / nonlinear trend analysis approach. I am pretty excited about where we are on the modes.
What does the S&P 500 say about … WWIII with Iran? The S&P 500 breakout signals that the market is putting Iran concerns behind it. The latest “big view” news is China moving forward with new trade deal and it is well received so far. Democrat pundits are losing steam pushing the WWIII narrative, they seem like they are simply trying to bash Trump, not provide a accurate reflection of the situation.
Note: The following comments are based on using technical analysis to ‘flesh out’ our nonlinear trading signals. TTP (Theoretical Transaction Day) is defined as the closing price on the day following the signal day.
Nonlinear Trading Themes:
S&P 500 forecast (Bullish, SPX): The breakout for the new year is punching higher. Nonlinear trend / Chaotic trend analysis is indicating the uptrend is still in place, so we are not seeing overbought readings yet. Let’s see what next week brings but it should include higher prices.
Master Sergeant Bilko (the movie version) said, “I like a sporting event in which I know the outcome beforehand, it’s more organized.”
GH Garrett – Chief Market Analyst for ConquertheMummy.com © 2015-2020, “Nonlinear trading signals that matter in stock index and S&P 500 trading. Determine the future direction of the S&P and trading becomes much less complex.”