Tag Archives: bitcoin trading.

Bitcoin model Version 2, now on the prowl!

Current Model (version 2.0) positions:

  • $NYXBT (Bitcoin), Long Trend, sig= 04/19, TSP=Friday’s close

Model notes: The previous model allowed a greater drawdown than I was comfortable with. V2.0 is the most sophisticated model we have had at CTM. I am very proud and excited to follow the progress. This is the inaugural signal (it is bullish just like V-1 one was). Bitcoin is one of the strangest markets and probably the least understood. Can nonlinear analysis shed light on this exotic trading vehicle. I am looking for a great (accurate) second half of the year! Exciting stuff!

Note: The following comments are based on using technical analysis to ‘flesh out’ our nonlinear trading signals. TSP is defined as the closing price on the day following the signal day.


Nonlinear Trading Themes:
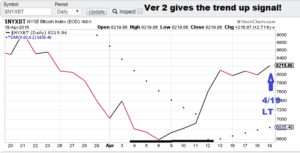
  • Bullish trend ($NYXBT): The new model would have caught this market much closer to the early-month lows (except it wasn’t completed until recently).  We see a support level at 6600. Nonlinear analysis says the trend is up! Look for the TSP for this signal to be tomorrows close!


Premium Research notes:

Observation: We now have the new fee structure in place (check the “Fees” tab for details). Get your independent research here, put my 25+ years of model building experience to work for you!

Take a minute to peruse the US Equities tab. I posted the S&P 500 trading signals postmortem for the recent March-April time period (approx. as it took about a week to generate a signal at the beginning). Plus 134 Points. Great stuff!

Take a minute to check out the Forex tab on our website. I am posting the recent US Dollar May-June signals. No whipsaws and playing the surprise Brexit vote just right. Great stuff!

Take a minute to take a minute to click on our bond trading tab. Our signals took the profits in the early month while holding the long interest rates position later. It never sold rates, hinting at higher rates to come. The TBT went higher outside our test window. A nice tip-off for the future!

Check out the energy tab. We tracked crude during the run up to the US presidential election. There was plenty negativity with a surprise ending. See how nonlinear analysis walked us through it!

GH Garrett – Chief Market Analyst for ConquertheMummy.com  © 2015-2018, “Nonlinear trading signals that matter in bitcoin trading.”
Bitcoin model now on the prowl!

Current Model positions:

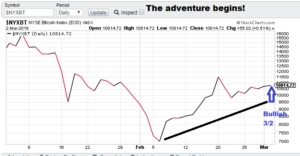
  • $NYXBT (Bitcoin), trend bullish, sig= 03/2, TSP=Monday’s close


Model notes: The Bitcoin model is now in place and we will be featuring it until the end of June. Bitcoin is one of the strangest markets and probably the least understood. Can nonlinear analysis shed light on this exotic trading vehicle. Exciting stuff.

Note: The following comments are based on using technical analysis to ‘flesh out’ our nonlinear trading signals. TSP is defined as the closing price on the day following the signal day.

Nonlinear Trading Themes:

  • Bullish trend ($NYXBT): This market has taken some hits in the past as commercialization has bought seller into the ring. This means the market can go up or down. Nonlinear analysis is calling the trend up. The inference is that the 7000 level is a viable support area and not likely to be violated. This is our first signal for this market.


Premium Research notes:

Observation: We now have the new fee structure in place (check the “Fees” tab for details). Get your independent research here, put my 25+ years of model building experience to work for you!

Take a minute to peruse the US Equities tab. I posted the S&P 500 trading signals postmortem for the recent March-April time period (approx. as it took about a week to generate a signal at the beginning). Plus 134 Points. Great stuff!

Take a minute to check out the Forex tab on our website. I am posting the recent US Dollar May-June signals. No whipsaws and playing the surprise Brexit vote just right. Great stuff!

Take a minute to take a minute to click on our bond trading tab. Our signals took the profits in the early month while holding the long interest rates position later. It never sold rates, hinting at higher rates to come. The TBT went higher outside our test window. A nice tip-off for the future!

Check out the energy tab. We tracked crude during the run up to the US presidential election. There was plenty negativity with a surprise ending. See how nonlinear analysis walked us through it!

GH Garrett – Chief Market Analyst for ConquertheMummy.com  © 2015-2018, “Nonlinear trading signals that matter in VIX trading.”

Bulls in control of financial markets

Current Model positions:

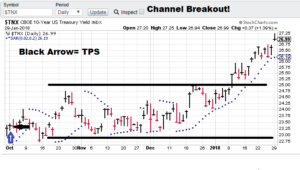
  • $TNX (rates) bullish signal date = 10/02, TSP = 23.34
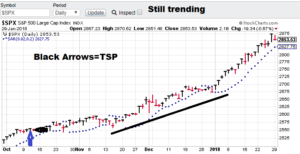
  • $SPX bullish signal date= 10/11, TSP = 2550.93


Model notes: The models continue to avoid “being faked out” (selling too early in a sustained uptrend) a common problem in overly optimized systems. Still waiting to get the final answer on the upcoming Bitcoin model. Exciting stuff. Let’s look at the charts.


Note: The following comments are based on using technical analysis to ‘flesh out’ our nonlinear trading signals. TSP is defined as the closing price on the day following the signal day.


Nonlinear Trading Themes:

  • Bullish Yields ($TNX): This market has broken north of a trading channel. The rate malaise in 2017 was a constant source of speculation as the stock market rocketed off. I guess the bond guys ran out of buyers.
  • Bullish Trend Stocks ($SPX): Stocks hit some selling today. There may be some follow-through selling but the force of the recent bullish acceleration does not appear to be in danger yet.


Premium Research notes:

Observation: We now have the new fee structure in place (check the “Fees” tab for details). Get your independent research here, put my 25+ years of model building experience to work for you!

Take a minute to peruse the US Equities tab. I posted the S&P 500 trading signals postmortem for the recent March-April time period (approx. as it took about a week to generate a signal at the beginning). Plus 134 Points. Great stuff!

Take a minute to check out the Forex tab on our website. I am posting the recent US Dollar May-June signals. No whipsaws and playing the surprise Brexit vote just right. Great stuff!

Take a minute to take a minute to click on our bond trading tab. Our signals took the profits in the early month while holding the long interest rates position later. It never sold rates, hinting at higher rates to come. The TBT went higher outside our test window. A nice tip-off for the future!

Check out the energy tab. We tracked crude during the run up to the US presidential election. There was plenty negativity with a surprise ending. See how nonlinear analysis walked us through it!

GH Garrett – Chief Market Analyst for ConquertheMummy.com  © 2015-2018, “Nonlinear trading signals that matter in VIX trading.”

Financial Markets Power up!

Current Model positions:

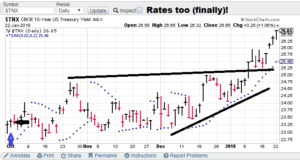
  • $TNX (rates) bullish signal date = 10/02, TSP = 23.34
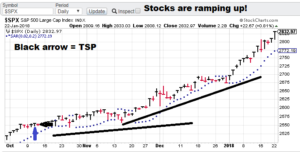
  • $SPX bullish signal date= 10/11, TSP = 2550.93


Model notes: The models continue the to track these markets pretty well. One of the weaknesses in models can be the tendency to pick “tops” during powerful uptrends, that really are not tops. It is called being faked out. So far, the models are staying with the market movement. Bitcoin is going to be joining us soon. Very exciting stuff. Let’s look at the charts.


Note: The following comments are based on using technical analysis to ‘flesh out’ our nonlinear trading signals. TSP is defined as the closing price on the day following the signal day.


Nonlinear Trading Themes:

  • Bullish Yields ($TNX): Rates are starting to ramp up. The US Government shut down, though duration expectations are modest, are probably helping with this. If the shut down duration becomes more of a concern a convexity may occur. Anyway, we are tracking the trend pretty well.
  • Bullish Trend Stocks ($SPX): The Jan 16 one day technical reversal had no follow-through and the nonlinear models were not fooled either. So here we go!


Premium Research notes:

Observation: We now have the new fee structure in place (check the “Fees” tab for details). Get your independent research here, put my 25+ years of model building experience to work for you!

Take a minute to peruse the US Equities tab. I posted the S&P 500 trading signals postmortem for the recent March-April time period (approx. as it took about a week to generate a signal at the beginning). Plus 134 Points. Great stuff!

Take a minute to check out the Forex tab on our website. I am posting the recent US Dollar May-June signals. No whipsaws and playing the surprise Brexit vote just right. Great stuff!

Take a minute to take a minute to click on our bond trading tab. Our signals took the profits in the early month while holding the long interest rates position later. It never sold rates, hinting at higher rates to come. The TBT went higher outside our test window. A nice tip-off for the future!

Check out the energy tab. We tracked crude during the run up to the US presidential election. There was plenty negativity with a surprise ending. See how nonlinear analysis walked us through it!

GH Garrett – Chief Market Analyst for ConquertheMummy.com  © 2015-2018, “Nonlinear trading signals that matter in VIX trading.”